
Buoyant economies, overvalued equities
- Stock markets have corrected a lot since late January, but from a longer-term perspective, the correction has been modest so far. Stock prices remain very elevated. It is not a foregone conclusion, though, that we are in the early stages of a major decline of equity indices – easy monetary and fiscal policies across the advanced economies, robust global economic growth and healthy and rising corporate profits are a benign environment where it is counterintuitive to suggest that it is about time to lighten up on stocks.
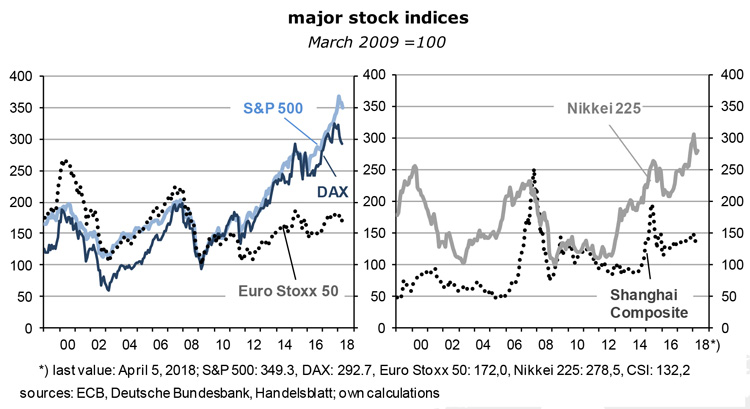
- As the graphs show, long-lasting and significant sell-offs are a defining feature of stock markets. The higher they go the deeper they fall. In the United States, in Germany and Japan the recovery from the synchronized lows of the Great Recession (March 6, 2009) to the most recent peaks (the week after January 20, 2018) has averaged 17.6% (U.S.), 15.9% (Germany) and 14.5% (Japan) per year, in each case several times faster than the growth rate of nominal GDP. This almost calls for major corrections. The differences between the three markets have been very small, and can mostly be explained by differences in inflation. It looks like there is already something like a common stock market among the major economies of the OECD area.
- China has been a somewhat different story. The stock market boom that began at the end of October 2008 culminated in June 2015 already, after a rally of 19.3% per year, followed by an eight-month decline of 45%. Stock prices had then recovered, without reaching the previous bubbly high again, and only to be dragged down in the past two months in lock-step with OECD markets.
a long bull market approaches its end
- Stock market rallies never die of old age. The main reason for a continuation of the bear market is the simple fact that stock prices are so high, especially in the U.S., that it makes more and more sense to take profits. Even after the 7.3 % decline since the peak in January, the price-to-earnings ratio of the S&P 500 is still 21.5 and thus far above the historical average of 16.8. A return to “normal” would imply an additional fall of 25%, or more if we either get a repeat of the usual overshooting in a bear market or a reduction of per share profits in the next recession.
- Incidentally, NASDAQ, America’s tech index, is trading at an ambitious p/e ratio of 26.8. As profit expectations are scaled back in the sector, not least because of misgivings about how these firms manage their users’ personal data, a crash there becomes increasingly likely. It would spill over into the other stock markets in the U.S. and the rest of the world.
- Another trigger that could bring down stock markets is rising interest rates. The so-called present value of future profits and/or dividends – and thus of stock prices – depends on the discount (ie, interest) rate: the higher it is, the lower the present value. This means that the expected steady increase of America’s Fed funds rate (which is the basis for the discounting algorithm) leads almost automatically to a decline of stock prices.
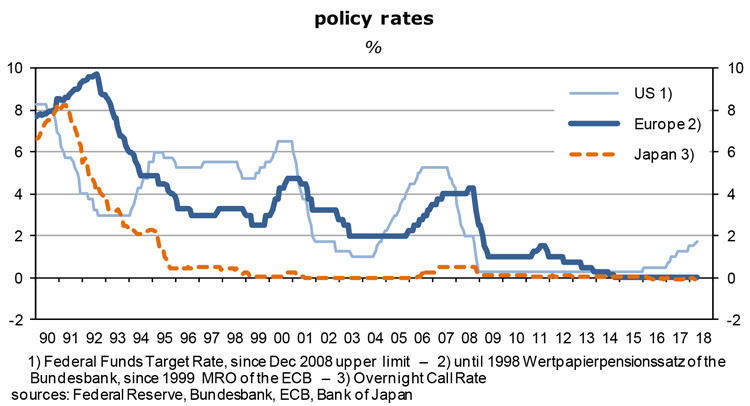
- As the graph shows, the U.S. central bank began to raise the policy rate since December 2015. The minutes of the last board (“FOMC”) meeting show that two further 25 basis point increases are foreseen in 2018, and another three in 2019, which would bring it to about 3% by the end of next year. The headwind from monetary policies is gradually getting stronger.
- But even at 3%, the Fed funds rate would still be low. The OECD now expects America’s real GDP to expand by 2.9 percent in 2018, followed by 2.8 percent next year. This is an upward revision of last fall’s forecasts by 0.6 to 0.7 percentage points, partly reflecting the strong impact of the significant easing of fiscal policies earlier this year: the marginal corporate income tax had been cut to 21 percent, personal income tax rates were reduced for seven years, the rate of “bonus” depreciation was raised to 100 percent in 2018-2022, and the new spending ceilings for both 2018 and 2019 were higher than previously expected.
- In nominal terms, U.S. GDP currently appears to expand at an underlying rate of almost 4 ½ percent. As a rule of thumb, this number is the most obvious estimate of the “equilibrium” or “appropriate” policy rate (and also determines the long-term riskless bond yield). In other words, the fact that the Fed does not expect a Funds rate of more than 3% indicates that it plans to remain very accommodative for a long time.
inflation refuses to accelerate
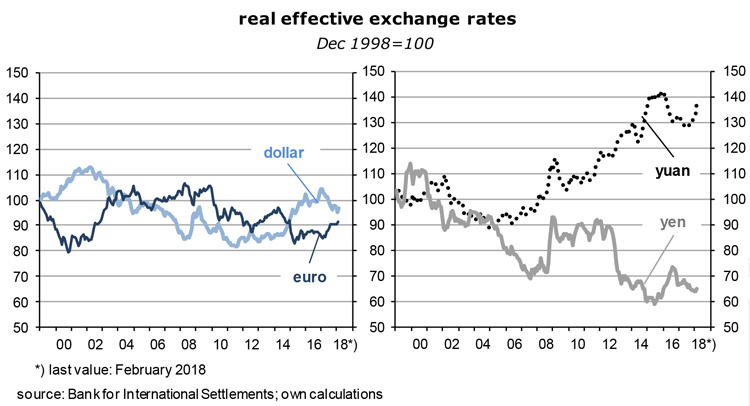
- Where is inflation in all of this? It should be rising steeply, but doesn’t. In addition to the expansionary effects of monetary and fiscal policies which I have described above, inflation should have increased for other reasons: the dollar has depreciated by 6 ½ percent in real effective terms over the course of last year (see graph), dollar-denominated commodity prices have increased by about 9 percent between 2016 and 2017, and the unemployment rate has declined to 4.1 percent. Growth is strong and full employment is near. Yet core inflation is still only 1.6 percent year-on-year.
- The answer is wages. On an hourly basis, they are just 2.6 percent higher than one year ago – for eight years now wage inflation has fluctuated between 1 ½ and 2 ½ percent. The recent slight acceleration has been one of the reasons for the stock market correction. It has not been a dramatic change of direction, though, and certainly not the beginning of a new wage/inflation spiral. If I adjust wages by the average eight-year increase in labor productivity of 0.8 percent I get an increase of unit labor costs of between 0.7 and 1.7 percent a year. This means that it is mainly the very slow increase of the cost of labor which continues to hold US inflation below the 2 percent target line.
- Why is US wage inflation so low, and do I see any change coming? Here are three answers: (1) The global supply of labor keeps expanding as fast, or faster, than demand. As emerging economies industrialize, poorly paid workers there leave agriculture and move to the manufacturing centers. At the same time, low transportation costs and continuously improving market transparency create something approaching a single global market place – which has the side effect that workers in Chicago or Stuttgart compete increasingly with poorly-paid workers in Shanghai and Seoul, at the expense of their negotiating power. As long as the process lasts, employees in rich countries will be unable to enforce substantial real wage hikes.
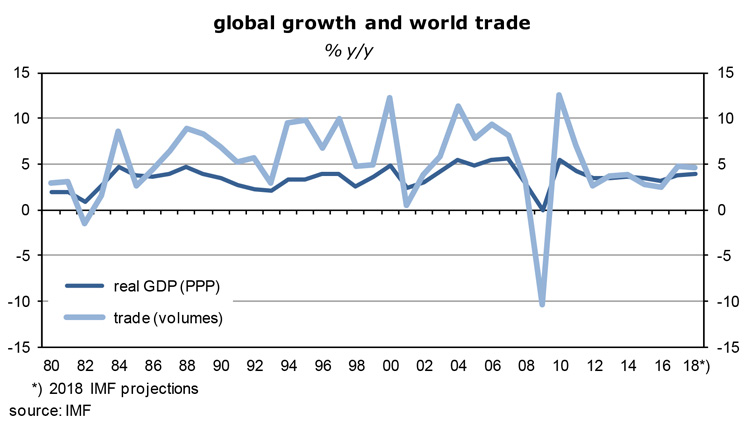
- As the next graph shows, even though the international division of labor may not intensify as dramatically as before the Great Recession, the volume of world trade keeps rising at a higher rate than global GDP again. The world’s pool of underemployed workers is shrinking but it is certainly not yet exhausted.
- (2) Then there is the so-called composition effect. The ratio of unskilled to skilled workers rises in response to labor-saving innovation in manufacturing, construction, transportation, mining, agriculture, fishing, even in medicine, law, intermediation, software and education. Routine jobs which can be replaced by robots, other machines and processes, or by some sort of software, will be replaced. The reserve army of temporary, part-time and insecure workers, in combination with the decline of labor unions, puts downward pressure on the wages of the unskilled.
- (3) I would also argue that there are as yet no capacity constraints in industrialized economies. Big economics departments at the IMF, the OECD, the European Commission or the German research institutes have identified a break in the growth rate of potential GDP at around the time of the Great Recession, ie, in 2008/2009. Suddenly, trend GDP in advanced economies was supposed to be about one percentage point lower than before, roughly 1 ¼ rather than 2 ¼ percent. If potential GDP does indeed grow only very slowly, it does not take much for actual GDP to hit its capacity ceiling – at which point inflation is supposed to take off. It has not happened.
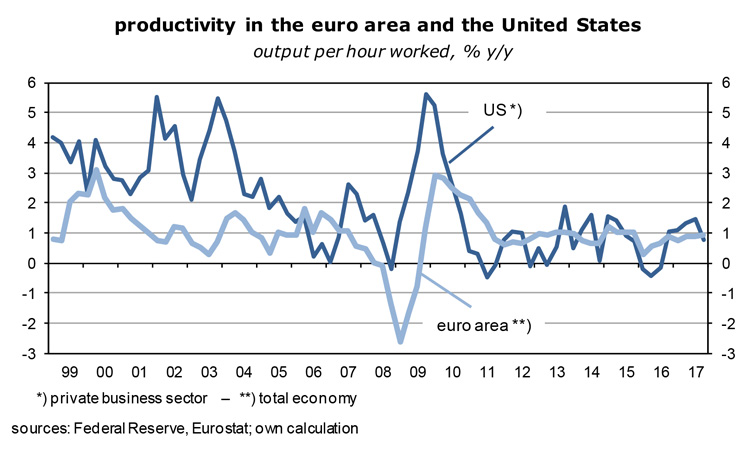
- The absence of inflationary pressures suggests to me that there is still a substantial output gap. Moreover, I do not see why trend productivity and trend employment, which together determine the growth rate of potential GDP, should have changed so quickly and significantly. There is certainly no lack of innovation, and capital spending is back to previous standards while recent statistics show that productivity growth holds steady at around 1 percent, both in the US and the euro area. Strong final demand and ample capacity reserves have revived productivity.
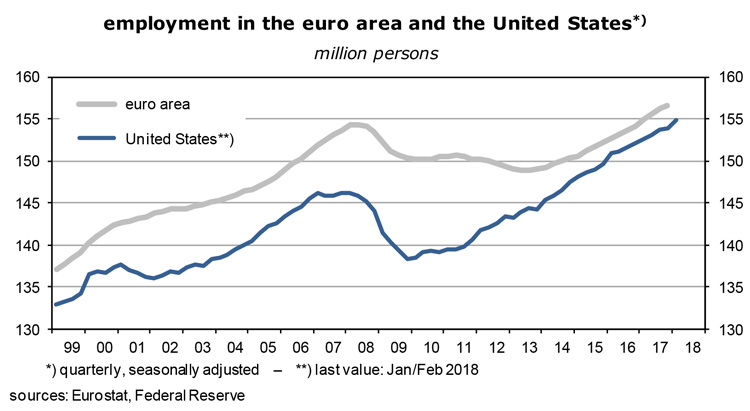
- In addition, employment in the US (and the euro area) is rising at rates of no less than 1 ½ percent again. There are no serious supply constraints in the labor market and it is therefore difficult to raise prices and wages.
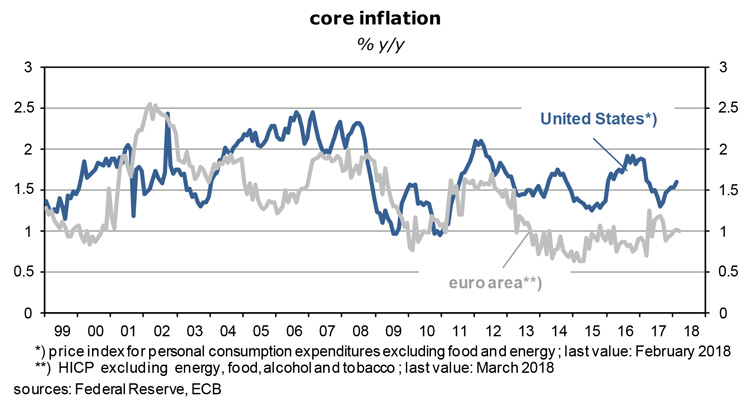
- The almost structural absence of wage inflation almost forces central banks in the OECD area to pursue easy policies. So far, they refuse to lower their inflation targets and start raising interest rates or, in the case of the US, raise them more aggressively. Central bankers argue that it may take longer than in the past to get inflation going but in the end buoyant economies will shrink output gaps, boost wages and raise actual and expected inflation towards the 2-percent targets. As the following graph shows, core consumer prices, as leading indicators of headline inflation, have not yet responded the way they should. So the wait continues.
ECB sees no need to tighten
- In the euro area, the last time core inflation came close to 2 percent was more than ten years ago. Actually, for the past five years it has stubbornly been around just 1 percent. According to inflation-protected government bonds, average expected consumer price inflation over the next five years is in the same order of magnitude: Germany 1.32%, France 1.25% and Italy 1.24%. Market participants are famously unreliable predictors of things to come, and they may once more be seriously wrong, but their expectations show that there is certainly no inflation mentality that could force the ECB to change course. Mario Draghi and his colleagues are not under pressure to act. Buoyant growth, below-target inflation, shrinking government deficits, plenty of new jobs and an appreciating currency are quite a pleasant mix, not a problem that needs to be fixed.
- Europe’s economic situation is improving in great strides but it is not yet good and thus needs further support from monetary and fiscal policies. The main trouble spot is unemployment which still stands at 8.5 percent (compared to America’s 4.1 percent). The so-called underemployment rate is a catastrophically high 17.1 percent. It represents no less than 29 million people who are either out of work, have given up looking, are not immediately available or are involuntarily working part-time. Youth unemployment (under 25 years of age) was 17.7 percent in February – even if it continues to fall as rapidly as in the past four years, it will take until early 2025 before it reaches 6 percent, a level where it would cease to be a worry.
- These numbers, in combination with the 1 percent core inflation rate, are the main reason why the ECB will not tighten policies yet. The asset purchasing program may run out between September and the end of the year, but the deposit rate and the main refinancing rate will stay where they are – at -0.4% and 0% – well into 2019 and possibly beyond.
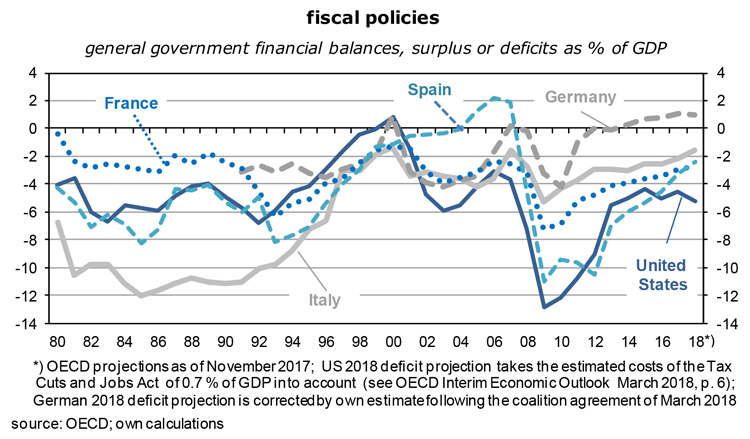
- While the Trump tax and spending reforms have given a strong boost to America’s domestic demand and GDP growth, euro area fiscal policies are not yet expansionary (see the next graph), at least in aggregated terms. After the March agreement between the coalition partners of the fourth Merkel government it is not likely any more that Germany will head towards a fiscal surplus of about 1 ½ percent of GDP in 2018. This had been the OECD’s projection last November. Policies are easing a bit. There will still be a surplus but it will “only” be in the order of 1 percent. For the euro area as a whole the deficit will be around 1 percent of GDP, as in 2017, steadily down from a shortfall of 6.3 percent in 2009.
- In spite of high unemployment, most euro area countries are still trying to reduce their deficits to well below the Maastricht limit of 3 percent of GDP in order to create a buffer for the time of the next recession. At first glance, this looks like pro-cyclical policies, but the restrictive effects on final demand and growth are actually quite moderate because the debt service, the key swing factor, is on the way down across the region – thanks to the low-interest policy of the ECB. Easy monetary policies are a necessary counterweight to the prevailing fiscal strategies. In the final analysis they are responsible for the resilience of the euro and the low interest rates which formerly spendthrift countries such as France, Italy, Spain, Portugal and Greece pay on their debt these days.
- Inflation expectations are lower than in the US, but not by much. Going by the breakeven rates of “inflation linkers”, the difference is about 0.75 percentage points per year for the next ten years and thus much smaller than the bond yield differential of 2.30 points (10y US Treasuries at 2.82%, 10y Bunds at 0.52%). Why is that?
- Market participants have begun to regard more or less all euro area governments as solid borrowers. It helps that the ECB has left no doubt that policy rates will remain around zero well into 2019 or even beyond while the Fed has embarked on a tightening course. It is still possible to refinance euro-denominated bonds at negative short-term rates. Investors also do not believe any more that the euro is close to breaking up, and they trust that it will remain a strong currency, given the sound fundamentals. On the basis of swap rate differentials, the euro’s exchange rate will be $1.38 five years from now, and $1.48 in ten years.
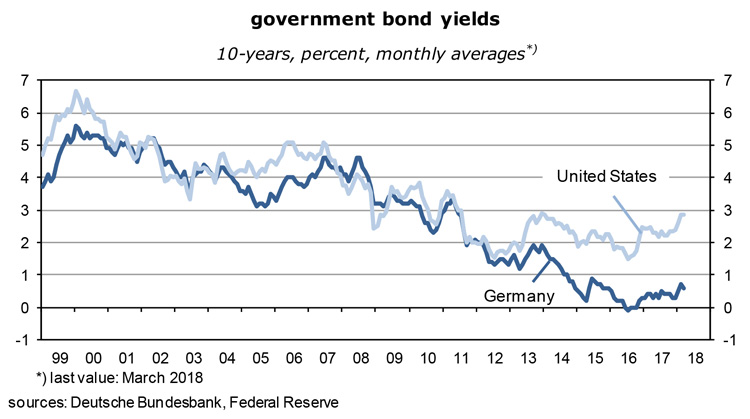
- As mentioned above, experience tells us that long-term bond yields fluctuate around the rate of nominal GDP growth which, in the euro area, is roughly the product of real GDP trend growth of (perhaps) 2 percent and the inflation target of 1.8 percent, ie, 3.8%. Even more so than in the US, investors’ views are thus completely at odds with economic reality. Germany’s 10-year yield should be 3.8% but is only 0.52%. At some point the gap will close, as things eventually normalize. It can happen in two ways: either via another deep recession or via a huge acceleration of inflation. In the first alternative, we would get a stock market crash, in the second a blow-out of bond portfolios. Or we get a combination of the two.
- There are no signs that a normalisation of bond yields is imminent in the euro area. As to the outlook for the real economy, leading indicators such as economic sentiment, incoming orders to industry, or the expected growth of world trade, suggest that real GDP will continue to expand at a rate of about 2 ½ percent, unless something unforeseen interferes, like a full-blown global trade war, an explosion of the oil price or a stock market crash like in 2009, followed by enforced saving activity (“deleveraging”) and bank defaults.
- How about the chances of an unexpected acceleration of European consumer price inflation? Wage inflation, as the key determinant, is even lower than in the US – the most recent statistic about compensation per hour has been just 1.4 percent year-on-year, and unit labor costs which take into account productivity growth are at 0.7 percent. Wages continue to pull down headline inflation.
- In addition, the appreciating euro insulates the economy from higher oil and other commodity prices; Germany’s import and export prices were up only 0.6 and 0.8 percent year-on-year in January. Since the euro area will show a current account surplus of about 3 percent of GDP in 2018, it is more likely that the euro will appreciate than depreciate – which would be a further powerful drag on the inflation rate of the euro area.
… and now to the risks
- The picture that I have painted above is quite optimistic, perhaps too optimistic. What could go wrong? Here are some of the risks.
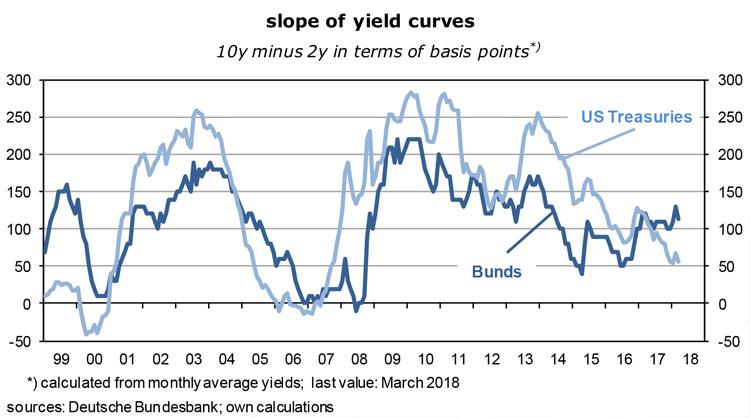
- American analysts have a pet early indicator of a coming recession – the slope of the yield curve. When it inverts the risk of such an event rises. As the following graph shows, the difference between 10 and 2-year yields had indeed turned negative before America’s last two recessions. Since about 2013, the slope has flattened from about 250 basis to about 50 today and thus seems to approach the next inversion. In Germany right now, the curve is steepening which suggests that growth will continue, at least for the time being.
- The Fed seems bent on raising the Funds rate by 50 basis points before the year is over. The slope of the yield curve then depends on what will happen at the long end – which is mostly driven by inflation expectations. These are at 2.1 percent. Together with a real GDP trend growth rate of 2 ½ percent, a “normal” 10-year yield would then be about 4 ½%, compared to the actual 10-year interest rate of 2.82%.
- In one scenario, yields could rise quickly, causing a steepening of the yield curve, if, for example, the Chinese, the largest holders of US Treasuries by far, decide to dump their dollar portfolio in an escalating trade war with the United States. Since this would be accompanied by a dollar depreciation, a US recession would be unlikely. In an opposite scenario, long yields could fall: triggered by a stock market crash, deflation risks would increase, bond yields would fall, followed by an inverted yield curve, and a recession.
- I am not convinced of the value of such an analysis. It does not make much sense to have an inversion of the yield curve as a result of a recession, it should be the other way around, first the inversion, then the recession.
- One major risk is a sell-out on American and European stock markets. Prices and valuations are so elevated that no one would be surprised by such an event. Investors know that it is part of the game and might actually appreciate the opportunity to re-enter the market at lower prices. But if the bull market was supported by a big increase of private sector debt, ie, a strong dose of leverage, many market participants could quickly be financially under water and be forced to repair their balance sheets by cutting back on spending which in turn could cause a recession. Where are we in this regard? The following graph is not really clear on that issue.
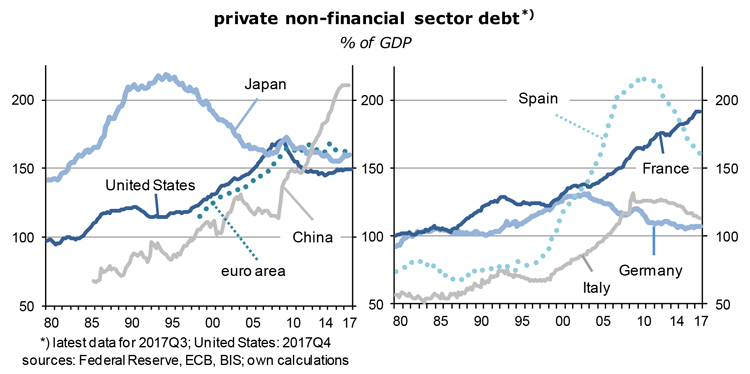
- Risks of private sector over-indebtedness are moderate or non-existent in Germany and Italy, given that their debt ratios have declined for several years and are now not much more than 100 percent of GDP. The US, Japan, Spain and the euro area as a whole have reduced their debt levels since the crisis of 2008/2009, but still exceed 150 percent of GDP.
- The two scary outliers are China and France. Debt reduction seems to be an unknown term there. On the basis of other benchmarks, risks are fairly small in these two markets: price-to-earnings ratios are just somewhat higher than 15 and therefore close to historical averages. Moreover, average annual gains of the Chinese and French stock indices have been “only” 9.2 and 7.2 percent since the market lows of October 2008 and March 2009 and thus considerably less than the growth rates of American, German and Japanese stocks mentioned in the second paragraph.
- In other words, it might be that these countries’ stocks are not overly expensive. In China, investors could in addition bet on the fact that the government will not let large and/or state-owned companies fail. Hard to say. In general, market participants are fairly exuberant and use setbacks to load up on equities. Dividend yields are still considerably higher than bond yields which can be seen as an additional attraction in an environment where low policy rates and low inflation expectations keep down bond yields.
- A large increase of oil prices is another risk for the world economy and capital markets. Since the global economy is – and will be – expanding at almost 4 percent in volume, and about 6 percent in nominal terms, prices of the stuff are well supported fundamentally. Alternative energies from wind and solar are expanding rapidly but have yet to lead to a decline of oil demand and output – it is still rising, if only moderately at about 1 percent a year. But the tipping point is not far away any more which puts a lid on how much the oil price may rise from here.
- Moreover, at today’s $67.80 a barrel, oil is almost twice as expensive as at the end of 2015, the last low, and 240% above the levels that prevailed in the 17 years before 2002. Oil is not cheap! This also puts a limit on its potential upside. In other words, it will not be the oil price that causes the next turmoil in the world economy.
- The worry of the day is the escalating trade war between the US, China and Mexico. The immediate effect is on the profits of firms which are directly impacted, such as the producers and users of steel and aluminum. America’s customs duties not only lead to higher prices of these two products in the US, but in the rest of the world prices will probably fall: a given supply (capacity) faces a reduction of demand (from the US). There will obviously be structural changes in the pattern of global demand and supply, but overall the impact on the world economy will be small. I am assuming that China will not retaliate forcefully because it knows that it will suffer quite a lot and cannot win if it did.
- No, the main risk for capital markets is a sustained and significant correction of the major stock markets. They are expensive, and it is clear that future gains cannot be so large any more. As investors increasingly become aware of this, the temptation to realize book profits rises, and they will then scramble to get out of the door at some point, followed by forced selling of leveraged buyers and various negative knock-on effects. In such a scenario, good-quality bonds and high-dividend stocks are the investments of choice while growth stocks, real estate and commodities should be sold. As always, timing and identifying the trigger of the market correction are the main challenges.
Read the full article in PDF format:
Wermuths_Investment_Outlook_6April2018