
Almost everything is expensive
- For the first time in decades, the usually profitable investment strategy to diversify funds across asset classes – to do well even when one of them tanks – has not worked in 2018. Going forward, things do not look much better. There is no obviously undervalued market that promises high returns. And, worse, several signs are flashing red, or almost red, of a global economic slowdown after one of the longest expansions on record. What to do?
the U.S. stock market – darling of investors
- Start with equities. The value of the world’s stock markets are smaller than the combined value of government and corporate bond markets, but they get and deserve more attention because they are much more volatile, more prone to excesses, and because they generate higher returns in the long run – because of the risk premium of 4 to 6 percentage points per year over riskless government debt. For investors, it’s the compensation for the risk that corporations may go bankrupt, reduce or cut their dividends, and for the large swings in their stock prices.
- To give an example: while the “normal” performance of “riskless” 10-year Bunds or Treasuries is about 4½% per year (the product of expected inflation, real GDP trend growth and a term premium), a “normal” equity portfolio should yield between 8½% to 10½% annually. Investors with a long-term perspective sensibly put a substantial part of their money into stocks.
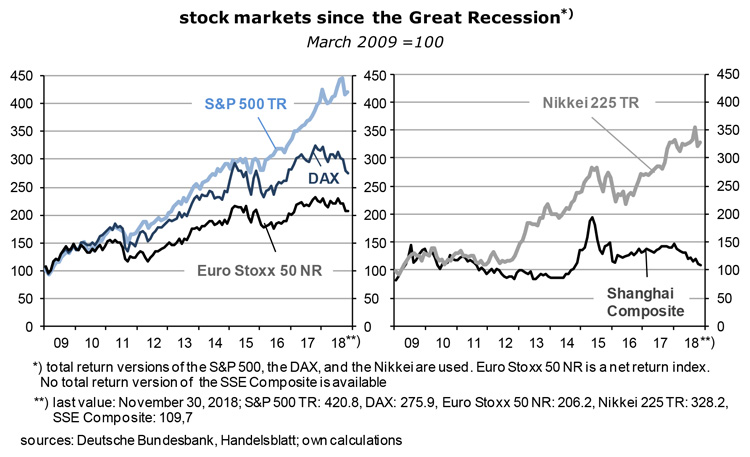
- In all likelihood, European and Asian stock indices of the main economies will end the year 2018 in negative territory. Year-to-date, the Nikkei is down 2%, the Shanghai Shenzhen CSI 300 is at -21% while the Euro Stoxx 50 has lost 9%, Switzerland’s SMI 4%, Germany’s DAX 13%, France’s CAC 40 6%, and so on in Europe. S. stock markets have done better, but not really well by past standards: the S&P 500 is at +3%, NASDAQ at +6%.
- There is a long list of adverse factors which can be held responsible for the disappointing performance, such as the tightening of US monetary policies, foreign currency debt problems in some important emerging economies, the escalation of the trade conflict between the US and China, the prospect of Brexit, Italy and its sovereign-bank loop, or the slowdown of Chinese growth. But for me, the main culprits are artificially high valuations, in an environment of low interest rates, ample liquidity and a lack of alternatives.
- Since the lower turning point of the business cycle in early 2009, total return indices of the major stock markets have increased at a much faster pace than nominal GDP. One could say, they have lost touch with the underlying economies.

- Even after the recent corrections, stock markets in OECD-countries are not yet cheap, and investors can therefore afford to wait. Bear markets are now well entrenched and will probably carry stock prices to much lower levels.
- This is also the message of the so-called cyclically adjusted price-to-earnings ratio (CAPE) of the S&P 500 index which can be traced back more than 100 years. The combined market capitalization of index members is presently about $24 tr, and thus exceeds the value of America’s GDP. The S&P 500 is the bellwether for most of the world’s other stock markets.
- CAPE is calculated regularly by Yale’s Robert Shiller. For the “e” he does not use today’s or tomorrow’s per-share earnings but “normalized” earnings, the average of the past decade. If these earnings are lower than today’s reported earnings – as they typically are toward the end of an expansion phase – they will yield a higher (cyclically adjusted) p/e ratio (because of the lower denominator). According to this approach, the relevant valuation of the S&P 500 is not the p/e ratio of 19 which I see on my screen, but the CAPE of 31. It is far above its long-term average of 16.9 and comparable to the level reached in December 1929, at the outset of the US depression. In other words, a genuine stock market crash is entirely possible. It must be said, though, that CAPE is not a very reliable indicator: occasionally it seems to have peaked, only to climb even higher. This happened throughout the nineties. It is just one indicator among several.

- As to the risk premium of the S&P 500 over “riskless” long-term bonds, its end-of-November value of 478 looks reasonable. It is calculated by deducting the real yield of 10-year Treasuries of 0.49% (2.99% minus the latest CPI, of 2.5% y/y) from the so-called earnings yield of 5.27% (the earnings yield is the inverse of the p/e ratio, ie, of 18.97). On the other hand, a price-to-book ratio of a rich 3.3 and an average dividend yield of just 1.9% suggest that the market is expensive.
- The tech companies listed on NASDAQ (market cap $11.2 tr) are even more overvalued. The price-to-earnings ratio of the index is no less than 41 – which translates into an earnings yield of just 2.44% and thus to a risk premium of 195 basis points. For a traditionally highly volatile market segment this is a very thin safety cushion. Moreover, the average price-to-book ratio is an ambitious 4.3 – obviously, stock prices of tech companies contain a lot of hype.
- Going by the differences between actual and forward-looking p/e ratios, market participants expect NASDAQ-earnings per share to increase by 90% over the next four quarters which explains why valuations are so high. This is clearly too optimistic given the late stage of the business cycle and the fact that companies such as Amazon, Alphabet (Google), Facebook or Apple are monopolists or near-monopolists which, by definition, cannot grow very fast any longer.
European equities are less expensive
- US stocks are thus rather expensive, especially compared to European stocks which continue to be the wallflowers among the world’s stock markets. Investors seem to assume that the euro and the currency union may blow up at some point. They shouldn’t be so skeptical: the ECB, the European Stability Mechanism ESM and the 19 governments have the means and the will to do whatever it takes to stabilize any member country that gets into trouble. The euro is here to stay.
- Consider the following numbers:
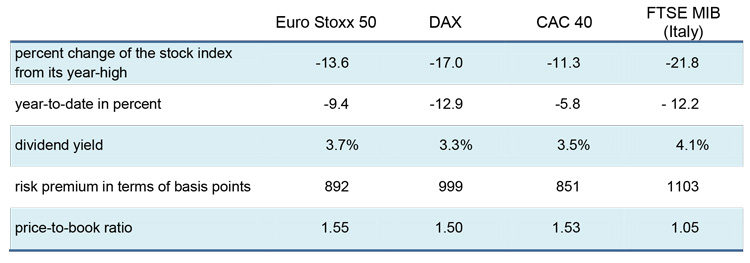
- So stock prices have come down at rates of 11 to 22% from their recent highs. They will probably fall some more as they cannot break free from the correction that is underway in the United States. But with dividend yields at around 3½%, price-to-book ratios of 1½% and risk premia of 850 to 1100 basis points, the time has come to gradually increase the share of euro area stocks in portfolios. The huge risk premia are a result of high earnings yields, ie, fairly low p/e ratios, plus negative real yields of 10-year German government bonds, the benchmark for riskless euro area assets which enters into the calculation of the risk premia.
- Take the Euro Stoxx 50: its earnings yield is 7.03% (the inverse of the p/e ratio of 14.2), from which one deducts the real yield of 10-y Bunds of -1.89% (= 0.31% – 2.2%), ie, 7.03 + 1.89 = 892 basis points. As long as euro area core inflation stays in the neighborhood of 1% – where it has now been for the past five years – Bund yields will remain low which in turn contributes to the very generous risk premium on European stocks and thus makes them attractive from a longer-term perspective.
depressed bond yields
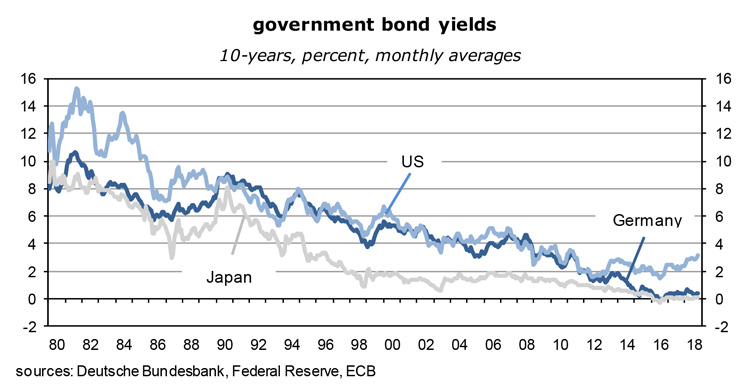
- This leads to the next topic – the outlook for bond yields. The main question is why they have been so low for so long. And now they are actually declining again.
- In the U.S., real 10-year Treasury yields are just 0.9% if actual core CPI is used as deflator (2.1% y/y). This is despite an almost 10-year economic expansion (four years more than in euroland), a record-low unemployment rate (of 3.8%), and a very large and therefore supposedly inflationary government budget deficit (of around 5½% of GDP). This is considerably lower than the trend growth rate of real GDP of more than 2% – which is the most plausible benchmark for real long-term government bond yields. What is happening here?
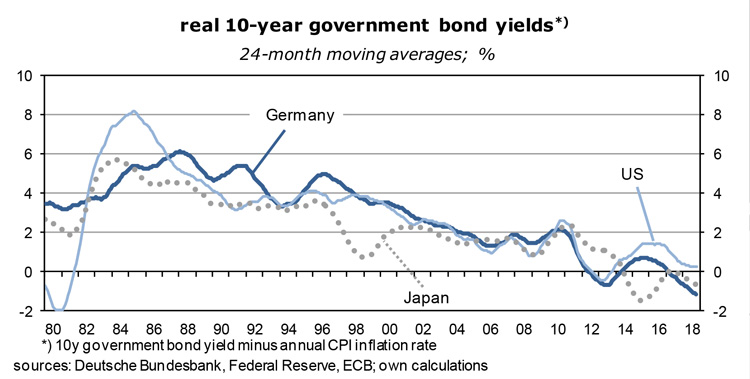
- In the euro area, the situation is even more extreme. As mentioned above, German 10-year bond yields are 0.31%, while 10-year EFSF bonds, backed by all member countries of the currency union, yield 0.76%. This implies that real long-term interest rates are negative: -0.69% and -0.24%. I have again used the y/y core consumer price index as deflator (1.0% y/y). Investors seem to assume that inflation will be below zero for a long time. Will the bond market follow the Japanese model? No more positive yields for years to come?
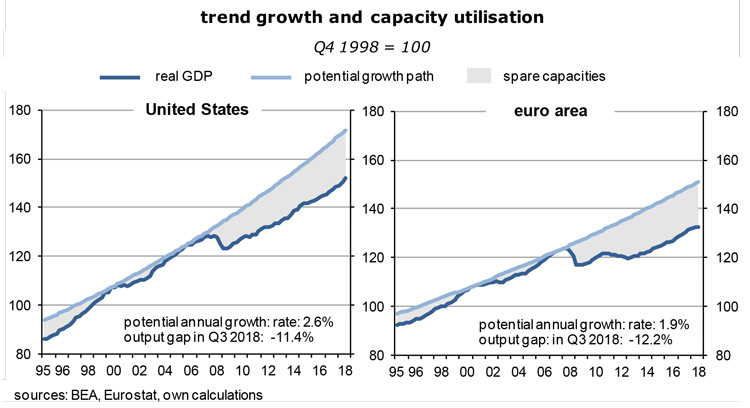
- The graph above, for a long time one of my favorites, suggests that there is a big gap between potential GDP (the trend line going through previous output peaks) and actual GDP. Both in the U.S. and the euro area the output gap is in the order of 11 to 12% of potential. I know that most economists do not like this approach and prefer a sort of 5-year moving average of real GDP as the best approximation of potential GDP growth, assuming that there has been, for reasons not well understood, though, a sudden structural reduction of productivity growth after 2009. For them, there are no spare capacities by now, implying that much higher inflation and much higher bond yields are just around the corner. Except that they aren’t.
why wage inflation will not accelerate
- In my view it is not surprising that inflation remains subdued. In an environment of large spare capacities firms and workers find it hard to raise prices and wages. Open borders and the increasingly intense international division of labor are other reasons for the downward pressure on inflation. Rapid productivity growth in emerging economies which are in the process of catching up with advanced economies, in combination with the equally rapid increase of the global labor force – as workers from rural areas continue to move to urban manufacturing centers – results in a fast growing supply of cheap tradable goods and, increasingly, services. This process has many years to run.
- Wages in the rich part of the world also suffer from the disappearance of blue collar jobs. Just as in agriculture before, manufacturing requires fewer and fewer workers, especially unskilled ones. The “gig” economy takes over (or becomes more important) where employment is precarious, often short-term and, because of the oversupply of labor, poorly paid.
- This structural change in labor markets explains why lots of people have a sense of insecurity – they cannot easily plan their future. They give up hope that traditional political institutions can help them. Many become xenophobic and drift to the extreme right. In general, free trade is less and less regarded as the fast road to economic happiness. A new social charter is urgently needed. Of course, not everybody loses. There are also winners – those who have the right qualifications and are willing and able to move to places where the jobs are. They will be paid quite well.
- On balance, labor is not a scarce resource. A “reserve army” exists even in the U.S., in spite of the low unemployment rate. For one, the so-called participation rate is still well below the level at the turn of the century (by four percent of the labor force). Returning to them would raise the available labor pool by about 8 million. Another indicator is the underemployment rate: it includes “discouraged” workers and stands at 7.4% of the labor force. It is the main measure of labor market slack.
- In the euro area, the situation remains outright bad, with an unemployment rate of 8.3%, an underemployment rate of 12% and an average youth unemployment rate of 17.3%. Europe’s poor labor market cannot all be blamed on the structural changes in the world economy, pro-cyclical fiscal policies supposedly required under the Maastricht Treaty also play a role, just as the fact that the present expansion of the economy began only in the first quarter of 2013 and is thus about four years younger than America’s. The labor market is lagging behind correspondingly.
- In any case, wage inflation will remain subdued which in turn keeps down headline and, especially, core inflation. The latter can be looked at as a leading indicator for future headline inflation.
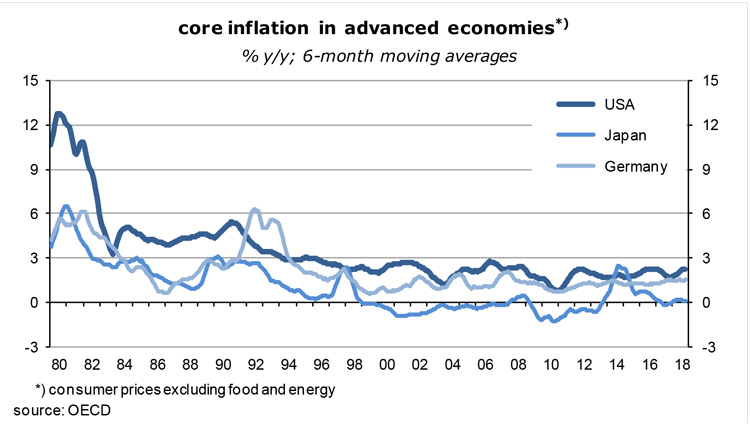
- While the ECB still tries to raise the euro area headline inflation rate sustainably toward 2% by keeping banks’ deposit rate at -0.4% and expanding its balance sheet, the U.S. central bank has been moderately restrictive for some time. Since December 2015 the Fed funds rate, the main policy rate, is on the way up, from near zero to an effective 2.2% now. It is planned to raise it further by another 75 or 100 basis points before mid-2019, to about 3% – which is generally seen as the peak of the present cycle. Since America’s core inflation has reached 2%, tighter monetary policies are justified. As the next graph shows, the Fed is also in the process of gradually shrinking its balance sheet and thus the supply of central bank money. Annualized real GDP growth rates of almost 4% in the past two quarters also suggest that restrictive measures are appropriate.

bond yields will not rise much
- Normally, a booming U.S. economy plus rising policy and inflation rates would be a recipe for a bond market sell-out. It is not happening. For the past six months, 10-year Treasuries have fluctuated around 3% and do not show signs of taking off toward 4 to 5% – where they belong from a historical perspective. A back-of-the-envelope calculation goes as follows: medium-term real GDP growth of 2% times target inflation of 2% times a term premium of ½% equals 4½%.
- What keeps bond markets from moving there? The two obvious suspects are expectations that, on the one hand, GDP growth will be less than those 2% (because productivity growth remains weak, the secular stagnation hypothesis) and/or, on the other hand, that inflation will soon decline to well below 2%. Inflation-protected U.S. government bonds show that market participants expect annual inflation to be almost 2% over the next ten years and thus lower than today. Moreover, America’s bond market is increasingly, if perhaps wrongly, regarded as a safe haven in an unsafe world; this creates additional demand and thus lowers yields.
- On top of all this, what would a recession do to dollar bonds? After an economic expansion of almost ten years, a fading fiscal stimulus, rising policy rates, the possibility of a trade war with China and a deep stock market correction, a recession in the U.S. is not just a distant possibility anymore, even though none of the large institutions which produce macroeconomic forecasts, such as the IMF, the OECD or the EU-Commission, expect one. The consensus is that U.S. real GDP will be up almost 3% in 2018 over 2017, followed by 2½% and a little less than 2% in 2019 and 2020.
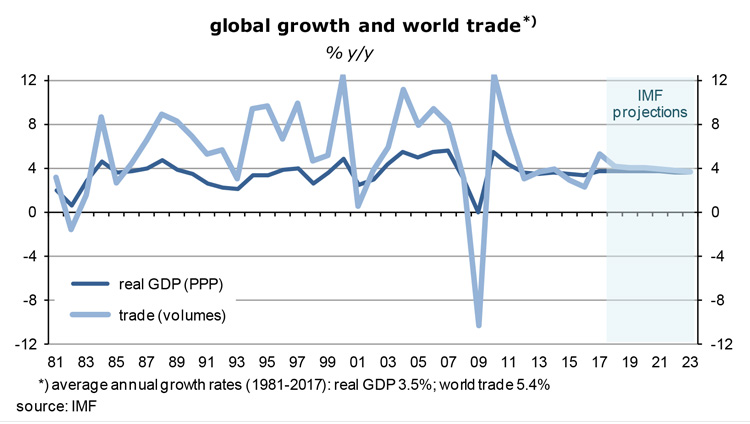
- The next graph, based on IMF data, shows that world economic growth will also remain steady (at about 4%). Investors should not be too impressed by these numbers: as long as there are business cycles, nothing is more normal than a recession. And keep in mind that official forecasters have never predicted a recession in the major economies, unless it was already well under way.
- A recession in the U.S. would widen the output gap there, drive down inflation expectations, headline inflation itself and the world’s commodity prices. The Fed would have to reverse course, start to lower interest rates and to expand the supply of central bank money again, in which case I expect a bond market rally and a widening of spreads between corporate and government bond yields. For investors, the strategy should then be to buy Treasuries and increase the duration of portfolios! The fact that the government budget deficit will probably rise to 6% of GDP or more is only a minor irritant in such a situation. For U.S. stock markets this would also be good news – the correction phase would end before it had begun in earnest.
ECB may run out of options
- For the euro area, an American recession, followed by a significant slowdown of global growth and, quite possibly, a large appreciation of the euro against the dollar, a reduction of corporate earnings and a further decline of stock prices would be a major challenge. Expect weaker foreign demand, a new increase of the European output gap, a fall in capital spending, a rise in unemployment, a stagnation or decline of employment, and much lower inflation rates. The fight against deflation would be back on the agenda. But the ECB has largely run out of powerful instruments. Whether new rounds of quantitative easing and long-term targeted lending would be effective measures is by no means certain. It is like pushing on a string. As to policy rates, they are so low they cannot be lowered anymore.
- For holders of bonds this is good news, especially if their portfolios have a long duration. They can expect capital gains. Borrowers such as the government and investment-grade corporates will also benefit. People who save for retirement with the aim to maintain their spending levels might react perversely and save more rather than less as yields come down. This has a pro-cyclical effect. Euroland may then become the new Japan, with very low growth and inflation for many years to come, large government deficits, money printing, a strong exchange rate – and zero or negative bond yields.

- In real terms, yields of euro-denominated investment grade bonds would certainly be stuck in negative territory if a recession would hit the euro area next year.
- This sounds, and is, extreme. In the more pleasant consensus view, European stock markets will soon bottom out (because they are not expensive anymore), GDP growth moderates to rates of around 1½%, wages respond to favorable labor market conditions and rise by more than 3% per year (after all, one assumption in this scenario is that there is no output gap!), core inflation leaves the 1%-barrier behind and crawls toward 2%, and the ECB can proceed as planned. Quantitative easing will end this December, and policy rates will be raised in late 2019. European bond yields would go up earlier as inflation expectations rise. In this scenario, Germany’s 10-year Bund yield may climb from 0.31% right now to perhaps 1%.
- So investment decisions ultimately depend on the answer to the question of whether there will soon be a significant slowing of economic growth in the U.S. Experience tells me that capital market risks are usually overstated, that animal spirits are stronger than suspected, and that the Fed will not hesitate to reverse course if there are indeed signs that the real economy slows too much. Since policy rates will be somewhere between 2½% and 3% when the decision must be made, there will be some room for maneuver. Low interest rates on government debt mean that fiscal policies can become more expansionary as well. In other words, investors should be aware of the risks, not be paralyzed by them. As traders often say, stock market bears are admired for their analytical skills, but it is the bulls who make the money.
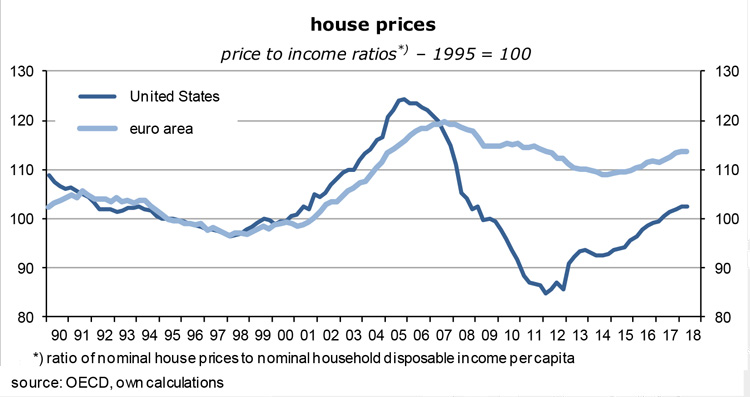
- For the stock market correction to turn into something nasty like the Great 2008/2009 Recession in the U.S. and Europe, or the Japanese shock of 1989/1990, requires two further elements, beyond the fact that stocks are overvalued: a real estate boom and a high degree of leverage.
- The next graph shows that relative to household incomes, U.S. house prices are at a reasonable level, about 20% below 2005, the peak of the previous housing boom.
- Leverage, defined as debt in percent of nominal GDP, has been on the way up since the end of 2007, before the escalation of the financial crisis. The following graph, taken from the BIS annual report, shows that it has increased from 179% to 217% at the end of 2017, to roughly $180 tr. The BIS statistics cover government, non-financial corporates and private households for both advanced and emerging economies. In the rich part of the world, the growth of debt has been brisk but not excessive. Just as the division of labor steadily intensifies, the credit links between economic agents increase in a trend-like manner. For everyone who saves there must be someone who borrows. Low real interest rates have also contributed to the increase of debt ratios over the past ten years.

- The bottom line is perhaps that debt levels remain high which in turn can make any correction of asset markets a dangerous affair, with the potential of triggering a downward spiral, once the famous Minsky moment has arrived where everyone rushes to the exits. But well-behaved U.S. and European house prices are probably a significant countervailing factor which prevents such a horror scenario.
China: slower growth, high debt
- Increasingly, investors have to take into account Chinese developments. The country’s economy is now larger than that of the United States in purchasing power terms, and roughly as large as the euro area on the basis of market exchange rates. In the past two decades it accounted for most of global growth. Given that its population is four times larger than America’s and that real GDP growth is about twice as rapid it is almost a foregone conclusion that it will soon dominate the world economy. For most countries, China is already the main or the second most important trading partner.
- Until very recently, it has also been one of the largest net exporters of capital, behind the euro area and Japan. Chinese capital markets are still comparatively small, not transparent and not truly open, though, and thus do not yet matter much for the rest of the world. It’s the real economy that counts, not so much its financial side. For the IMF, the pain caused by a growth slowdown in China will be regionally concentrated and confined – private capital flows into and out of China are much smaller than in the case of the U.S. Spillovers into other countries would be correspondingly small. Wishful thinking?
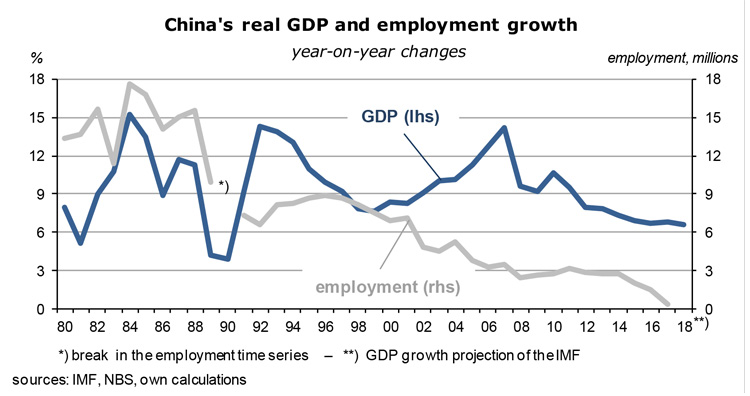
- Structural changes away from capital spending and exports and toward household consumption and services have led to a slowdown of growth, from annual 10½% rates in the decade to 2011, to 7½% and now to a little over 6% which, of course, is still a lot. True real GDP growth rates may actually be even lower than that: independent analysts who use indicators such as car registrations, container turnover or electricity generation put them at about 5%.
- Growth has also slowed because the capital stock is so huge already. As the next graph shows, saving and investment ratios have been between 30 and 50% for decades. The law of diminishing returns on capital is now quite visibly at work: there is still lots of new capital spending but its contribution to real GDP growth is getting smaller.

- It is a safe bet that a large portion of the country’s capital spending boom went into not-so-productive uses which in turn results in poor returns. Since private sector debt has gone up steeply in recent years, debt service could become a problem. There is a massive stock of savings, but at the same time leverage has also increased a lot. The problem is that savers and borrowers are not identical. Between early 2009 and early 2018, China’s private non-financial sector debt in percent of GDP has shot up from 127 to 213, and by much more in absolute terms because GDP growth had been rapid during that period. For comparison, the American debt ratio has declined from 171 to just 148 while euroland went from 159 to 164. China clearly has a problem.

- Add to this the risk of a trade war with the U.S., the move from a surplus to a deficit in the balance on current account and the steep decline of stock markets. It therefore does not come as a surprise that the government and the People’s Bank of China are worried about the economy. While monetary policies are getting tighter in the U.S., the euro area and many emerging economies, China will implement a significant policy stimulus in 2019, probably in the order of 2% of GDP. Sensibly, the focus will be on tax cuts rather than increased investment.
- Given its large domestic and foreign reserves, the ability of the country’s executive to move things and the depreciation of the yuan, it should be possible to avoid a recession, even though a likely real GDP growth rate of “just” 5½% may feel like one. Employment does not increase anymore (but productivity growth remains rapid).
- Various negative factors have been priced into China’s stock prices. Bad news may dominate in the near term, but the economy seems to approach a point where investors should take a closer look. Stocks are not overly expensive anymore.
Italy’s problems are more artificial than real
- The same goes for Italy where an unlikely populist coalition government has dared to confront the EU Commission over next year’s budget deficit: rather than sticking to its predecessor’s plan of 0.8% of GDP it aims for a deficit of 2.3% and is thus in breach of contract, so to speak. But the EU has little power to stop Italy from carrying out its fiscal plans. It will certainly not impose any fines – 26 of the 28 member countries had been placed under the Excessive Deficit Procedure before but none of them had to pay up.
- While the Italian government will neglect the Commission’s demand to reduce its deficit ratio, it cannot ignore market forces. Unless it produces evidence that it is serious about maintaining fiscal discipline the cost of borrowing would become dangerously high. This why it tries to avoid shocking investors. The new budget proposals are fairly moderate.
- In my view, Italy’s fiscal problems exist mostly because of the Maastricht Treaty: debt is at 132% of GDP which is way beyond the 60% medium-term EU target. Presenting this as a problem creates a problem. Note that the U.S. has a similar debt ratio (110%) while Japan is at 230%. Markets could not care less about these deficits. Both the dollar and the yen are actually regarded as safe haven currencies.

- Were it not for the demands of the Commission, more expansionary fiscal policies would exactly be the medicine a doctor might prescribe: household incomes are depressed and the output gap must be very large. A government is almost obliged to fill that gap as long as demand from households and business is too weak to bring about a return to full employment in the not-too-distant future. Look at these numbers: in the third quarter, real GDP was just 0.7% y/y, while the overall unemployment rate was still 10.6% (Oct); youth unemployment (< 25 years) stood at 32.5% (!). Real hourly wages have now stagnated for ten years. I sometimes wonder why the population accepts all this.

- Since 2013 the country runs an increasingly large current account surplus (recently 2½% of GDP) and has thus become a net exporter of capital. The so-called primary budget balance will show a surplus of 1.7% of GDP this year. In other words, Italy is pursuing very virtuous macroeconomic policies. No need to be admonished by Brussels to do even better.
- Investors continue to have doubts about Italy’s ability to service its debt, going by the present 290 basis point spread of 10-year government bonds over German Bunds. The spread has come down recently from even higher levels but is still so large that investors who need to buy bonds should increase their exposure to Italy, perhaps at the expense of German bonds.
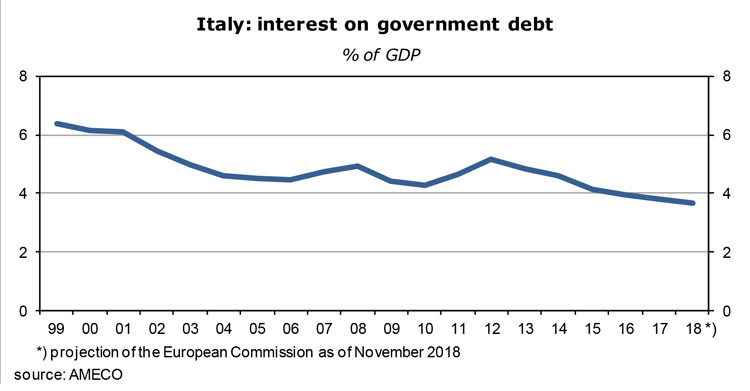
- The next graph shows that interest payments on government debt have steadily declined from 6.4% of GDP at the beginning of the currency union 20 years ago to just 3.8% this year. Let me also point out that Italy has a fairly high national saving rate (20.6%) and that government debt is mostly held domestically – which means the lack of an own central bank and the ability to print money to pay foreign creditors is not the serious disadvantage it is often made out to be by skeptical investors.
- In view of those impressive key fundamentals it is totally inconceivable that Italy will be kicked out of the euro. Italians overwhelmingly like the currency, despite the hardship associated with it – its purchasing power has been impressively stable, especially in comparison to the lira era. Italy is an ageing society, after all, where such a consideration matters. Moreover, if push comes to shove one day (which I do not expect) both the ECB and the finance ministers of the 26 partner countries will ride to the rescue, no matter what they are saying today.
other risks: emerging economies, oil prices and exchange rates
- As I have shown above, emerging economies have increased their leverage a lot since 2007. This includes debt denominated in dollars and, to a lesser extent, in euro, yen and yuan. A large portion of it is also floating rate which means that debt service can quickly become expensive and unbearable, not least because it would be accompanied by currency devaluations and recessions in the wake of monetary and fiscal tightening. This describes the recent experience of Argentina and Turkey. Countries such as Brazil, Pakistan, the Philippines or South Africa also have large external funding needs which become a problem as well should dollar interest rates rise too much. Twin deficits, in government budgets and the balance on current account, are the common denominator of these countries.
- Defaults would cause losses for creditors such as Italian and Spanish banks or exporters in rich countries. They have the potential to trigger the next financial crisis. Creditor countries are aware of the risks to their own economies and will therefore put pressure on the IMF to provide balance of payment support. They will also agree to easier terms on their own credits.
- As serious as the situation is, I am fairly sure that it will not get out of hand: short-term dollar interest rates will not rise by more than an additional 100 basis points, on top of the 200 basis point increase since December 2015. This looks manageable. In addition, the size of the amounts at risk is not dangerously large, given the combined firepower of the creditor countries and their institutions.
- Other than in the seventies and early eighties, oil prices have no longer the potential to wreak havoc in the world economy. Their relative importance continues to decline as oil consumers cut their dependence on the stuff. Alternative energy is quickly becoming a viable alternative. In other words, the oil intensity of GDP is on the way down. For years now, global real GDP has expanded at annual rates of 3½% while the demand for and the output of crude rises along a trend line of just 1% per year.
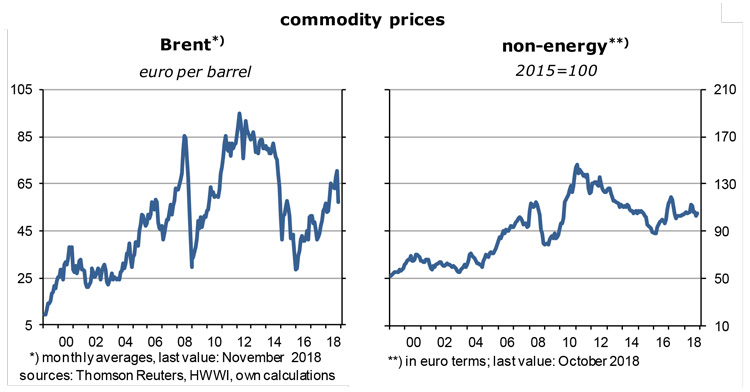
- The upside potential of oil prices is clearly limited, as we are seeing these days. Since early October the price of a barrel of Brent, the European benchmark, has fallen from $86.1 to $58.4, or by 32.2%. It has been about the same in euro terms which I use in the graph above. When oil prices rise to elevated levels compared to the cost of production, oil output responds more or less immediately – which pushes down its price. American shale producers are particularly responsive. Some years ago, all the talk was about a physical peak to oil production, now it is more about peak demand.
- Lower oil prices mean the purchasing power in oil importing countries rises – which provides a boost to final demand there. The flip side of this is that it also stimulates the demand for oil and for products such as SUVs and air travel that use oil as an input. Low oil prices are certainly not good for the environment. This is the strongest argument for taxes on the use of carbon fuels which bite. Governments must finally get serious about their climate targets. Nothing works better than higher prices.
- On balance, oil is not a risk at this point but rather a stabilizing element in an environment of slowing economic growth and falling stock markets.
- Finally, a look at exchange rates. I have been predicting for quite a while that the euro would appreciate against the dollar. This was on the basis of the main fundamental factors, differences in the balances on current account and budget deficits. On both counts, the euro area is in much better shape than the U.S. My model has not worked, though, because the dominating variable turned out to be capital flows, not the cross-border flow of goods and services. Investors were attracted by America’s steady and, more recently, accelerating economic growth which was reflected in strong profits and stock markets. They did not mind the country’s Keynesian monetary and fiscal policies, they actually found them appropriate.

- The U.S. did not experience anything comparable to the euro crisis and the pro-cyclical fiscal policies required under Maastricht. It helps that capital markets are a lot more liquid than in the euro area and that no one ever doubts that the dollar will be here tomorrow – when the euro may be just a distant memory. Progress toward a European capital market union and a common fiscal and social policy is clearly needed but is so incremental that market participants just don’t notice it. And thus don’t (or didn’t) have much trust in euro assets.
- From 2011 to today, the trade-weighted euro has appreciated by roughly 6% whereas the dollar has gained about 38%. The difference is reflected in a rising euro area surplus on current account as well as rising net capital exports, while the U.S. is running a fairly large trade deficit and a correspondingly large surplus in the capital balane. It has not been reflected, as one might expect, in rapid export-driven growth in the currency union and a noticeable slowdown of U.S. growth.
- The key difference in economic performance has been capital spending: over the past decade (which includes the recession year 2009), America’s volume of total investment has increased at an average annual rate of 2.3%; in the euro area the comparable number is -0.1%! To drive home the point: Europe’s focus is on tightening its belt – but it does not work.
- Going forward, it is likely that the Fed will soon stop raising interest rates while the ECB intends to raise them in late 2019, at least according to the consensus view. It is also likely that U.S. stock prices will fall by more than European ones (because they have been so weak already). In other words, chances are that the euro exchange rate against the dollar will bottom out sometime next year. On the basis of fundamentals, the euro has considerable upside potential in any case. Here I go again!
summary
- This has been an unusually long investment outlook. Let me therefore summarize the main points:
- Most stock markets had a very good run since the Great Recession, especially in the U.S.
- They are now in correction mode; U.S. markets are still in positive territory.
- So far, the correction in Europe has been much bigger.
- On the basis of various yardsticks, U.S. stocks are still seriously overpriced, tech stocks in particular. The strategy should be to buy companies that offer stable income and dividends such as health care and consumer staples.
- While euro area stocks are considerably less expensive than American stocks, they will still be dragged down some more when the U.S. sell-out starts in earnest one day.
- Nominal and real government bond yields are very low – but will not necessarily rise much.
- The main reason is subdued wage inflation in both advanced and emerging economies.
- The world moves toward an integrated labor market where poorly paid Asians determine wage inflation here and everywhere.
- Euro area core consumer price inflation has been around 1% for many years and seems to be stuck there; output gaps remain large.
- Expect an economic slowdown in the U.S. and an end of monetary tightening in about half a year as the fiscal stimulus fizzles out and the strength of the dollar makes itself felt in the real economy.
- The ECB may reconsider its plan to raise rates in late 2019 – because growth is weak and inflation rates will fall again. The problem: a lack of policy options.
- It is unlikely that the stock market decline will turn into something nasty: there is no housing bubble that might burst, and leverage in rich countries is fairly moderate.
- China is highly leveraged but I expect that the country has enough reserves to avoid an all-out debt crisis.
- Moreover, China’s stock markets and its exchange rate have been very weak already – a rebound looks plausible now.
- Italy pursues very disciplined macro policies and will not have problems serving its debt.
- The falling oil price boosts the purchasing power of consumers and importers of oil – but is negative for the environment; carbon prices must be raised steeply to prevent an increase of oil demand.
- Emerging economies with twin deficits get into trouble as dollar interest rates rise further, but the crisis can probably be managed by the combined financial power of creditors.
- After years of weakness, the euro will gain against the dollar, starting around the middle of next year.
Read the full article in PDF format:
Wermuths_Investment_Outlook_3December2018