
Asset allocation at a time of zero bond yields
- To stick to the standard formula of conservative investing these days – 60% stocks / 40% bonds – means that the larger part of the portfolio is exposed to assets which have yet to price in the effects of the global depression (ie, stocks) while the so-called fixed “income” part will not generate any income. The outlook is bleak. A new approach is needed. In the following I try to answer the question about how this could look like.
- As the chart on this page shows, the annual performance of a representative German government bond portfolio has been close to zero percent for about four years now.
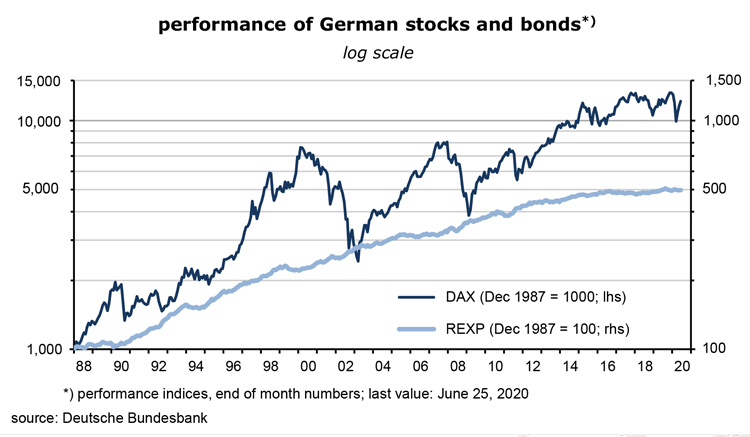
- In the past, when markets were not in deflationary mood, when central banks had still room for maneuver on the interest rate front, stocks had returned about 3 percentage points more than so-called riskless long-term government bonds. This premium was the compensation for the risk that firms could go bankrupt, that they might suspend their dividends and that prices of stocks were more volatile than those of bonds. The latter were the stabilizing factor in any portfolio. They reduced its volatility and generated a reliable cashflow in good times and bad.
- When bond yields are near zero or even negative, their positive effect on cashflows disappears.Investors will continue to appreciate their stabilizing effect on the overall performance of a portfolio, though, and keep buying them, if without much conviction. Governments of OECD countries can be trusted to meet their debt service obligations. Such bonds are almost like cash, and investors will try to reduce their share in the portfolio or shift to lower-rated corporate bonds.
- The performance of bonds will probably remain better for a while in countries where long-term interest rates are still relatively high. This includes the US, Greece, Italy, Spain and the UK. Yields there are converging toward low Swiss, German, Dutch, French and Japanese levels which will translate into (mostly modest) capital gains and a positive performance. Since the gap between actual and potential GDP is huge in those “high yield” countries, just as in the rest of the world, the likelihood of rising inflation, policy rates and bond yields is very low. In spite of the rapid increase in government deficits and debt there are no signs that bond yields have reached their lower turning point in these countries.
- In the 10-year range, the lowest government bond yield ever (I don’t really know) has been -1.2%, in Switzerland (August 15, 2019). I regard this as a proxy for the lower bound of long-term interest rates generally. In Germany, the all-time low has been -0.9% (March 9, 2020), Japan’s was -0.3% (July 22, 2016). At such low levels, investors will begin to switch from bonds to cash which carries an effective interest rate of zero, considerably more than on those bonds. If governments aim to issue bonds at rates significantly below 1% they have to get rid of cash. In this regard, the coming cashless economy is quite a temptation for public sector borrowers. For now, this is not a realistic prospect in OECD countries. Watch Sweden, though!
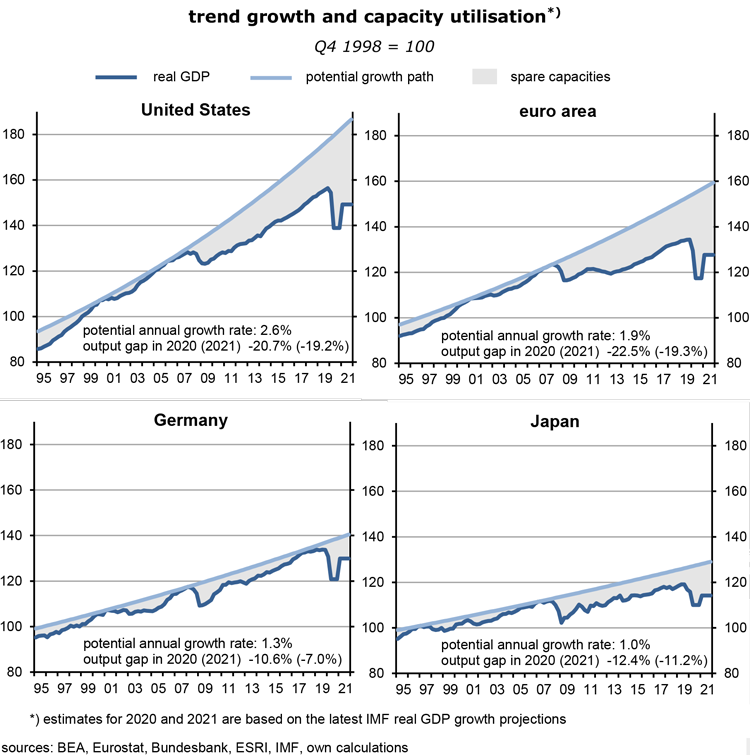
- Positively sloped yield curves have a generally underappreciated feature called “rolling down the yield curve”. On average and in the past, the book value of a bond kept rising simply due to the passage of time. Assume the yield of 10-year bonds was 6% and those of 1-year bonds 4.2%. If nothing happens, 10-year bonds will be 1-year bonds in nine years – they have rolled down from 6% to 4.2% – and have gained about 14% in value which made longer-dated bonds attractive assets: they generated positive cashflows as well as capital gains. If yield curves are flat, this effect does not exist any longer. In Germany, for instance, 10-year government bond yields are -0.40% while 1-year yields are -0.56, for a difference of just 16 basis points, the same, incidentally, as in Japan. This is hardly worth the effort. In the euro area, only Greece and Italy have still relatively steep yield curves, with a difference of just under 150 basis points between 10 years and 1 year; the US is at 57 basis points.
- If Japan is the role model for things to come in rich countries, financial investors can look forward to two important developments: (1) policy, and therefore money market rates are in, or move to the neighborhood of zero, and (2) yield curves will almost be flat from overnight rates to 10 years, if not longer. For reasons not well understood, Japanese consumer price inflation has averaged just 0.2% since 1995 – if the three hikes of indirect taxes during this time are excluded, the “normal” inflation rate has actually been a little below zero.
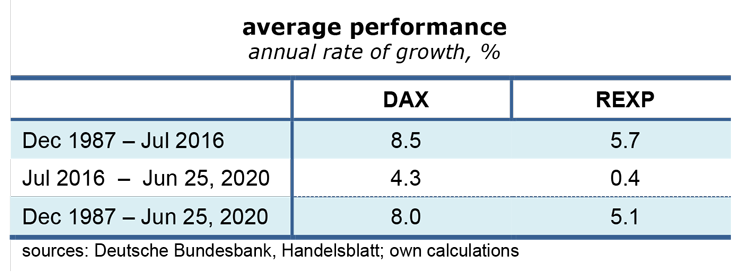
- My favorite explanation is that Japanese policy makers have not succeeded to close the output gap that had opened in the early nineties, in spite of unprecedented government deficits and government debt that will reach 268% of GDP this year (says the IMF). Put differently, the growth of demand for goods and services by households, the business sector and foreigners has never been strong enough to close the gap. The Japanese save too much. Idle capacities mean that the pricing power of firms and the negotiation power of workers have remained weak throughout. Add that the yen as a safe-haven currency has tended to appreciate in real terms which has kept export and import prices in check. No surprise then that inflation has been subdued in such an environment.
on the road to flat yield curves – here and there and everywhere
- Looking at the output gaps in the U.S. and Germany, I would therefore suggest that these countries face similar deflationary pressures. Both the Fed and the ECB will keep their foot on the accelerator for years to come. The COVID-19 crisis has caused an additional demand shock (to be sure, it is also a supply shock, if of a smaller magnitude) which has further widened the gaps. Labor income is shrinking while corporate profits are crashing (on average).
- The reason why we are heading for flat yield curves in the neighborhood of zero in much of the OECD region is the strategy of central banks. For one, if (short-term) policy rates are kept near zero for a long time, bond mathematics suggests that long interest rates will move toward zero as well. Point number two: central banks have become, and will probably remain large net buyers of bonds. Quantitative easing has become the main monetary tool after traditional interest policies have reached their limits. And point number three: they might follow the Bank of Japan in explicitly aiming to keep long-term (10-year) government bond yields near zero. The aim is to control the entire yield curve. Via arbitration processes this reduces the private sector’s cost of long-term borrowing to very low levels. Since the return on capital is higher than that, even in Japan, there is supposedly a strong incentive to borrow and invest in factors of production. It has not really worked – because the sales outlook is, as usual, more important than the cost of capital. The best that can be said is that without these strategies, inflation and growth would have been even lower.
- Here is a quote from the Bank of Japan of September 21, 2016, almost four years ago: “The Bank will purchase Japanese government bonds (JGBs) so that 10-year JGB yields will remain more or less at the current level (around zero percent)…. JGBs with a wide range of maturities will continue to be eligible for purchase…” In the June 16, 2020 Statement on Monetary Policy 2020 the BoJ stated again that “the Bank will purchase a necessary amount of … JGBs without setting an upper limit so that 10-year JGB yields will remain around zero percent. While doing so, the yields may move upward and downward to some extent mainly depending on developments in economic activity and prices.” In other words, the central bank monetizes government debt without a limit because the main target is to keep long-term yields at zero. Guess where Japan’s CPI is expected to average this year? -0.1% y/y!
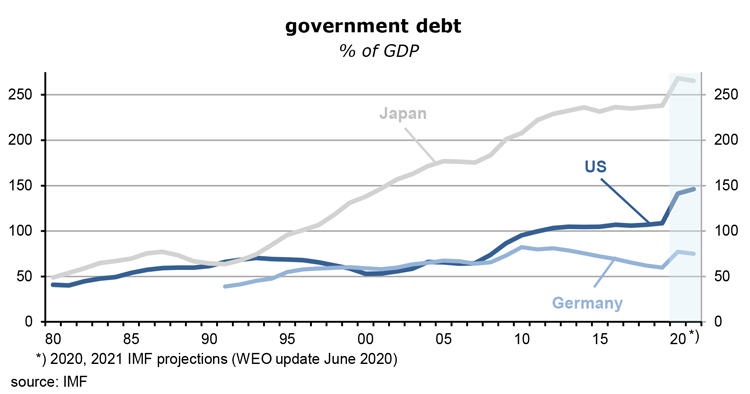
- If conditions are right, the monetization of government debt will not drive up yields. Over the long run, Japan has shown that even steeply rising government debt must not lead to high real or nominal bond yields. “Right conditions” means that the risk of accelerating inflation is low. Output gaps must be large. This is the case today. The IMF has just predicted that the overall fiscal balance of the U.S. government will be no less than 23.8% of GDP in 2020, and that gross debt will rise from 109% of GDP in 2019 to 141%. Market participants could not care less. Since the beginning of the year, yields of 10y Treasuries have fallen from 1.8% to 0.7%. Rising and historically excessive debt is no longer correlated with higher inflation and bond market panics.
- It’s not just an American phenomenon – the same is happening across Western Europe. Have a look at Italy, the usual suspect when it comes to irresponsible fiscal behavior: the yield in the 10-year range has declined from 1.35% in early January to 1.28% now while the government budget deficit will, according to the IMF, rise from 1.6% of GDP last year to no less than 12.7% (debt will hit 166%). It’s a puzzle only at first sight: the main point is that private sector demand has declined by much more than the increase in government borrowing, and that the output gap has increased in the process, rather than shrinking.
- But how about the concern that we are passing a huge debt burden on to our children? It’s a popular issue among politicians who like to equate financial strategies of households with that of the state. Emmanuel Macron was just quoted as saying “… il n’y pas d’argent magique. Un pays qui va vers les 100% de dette publique (…) ce sont vos enfants qui paieront.” The public sector debt of France will be 126% of GDP this year, after 98% in 2019. And 10y bond yields? Down from 0.02% in early January to -0.12% now! There is actually no burden that we are going to pass on to our children. If the capacity of the economy were used to the limit, the competition for funds would indeed drive up inflation expectations and yields. But we are far from such a situation.
- More generally, when the state increases its debt it shifts raising taxes into the future because in the end it has to service its debt. If, however, nominal GDP growth permanently exceeds market yields (which has been the case for some time already), debt will never need to be paid back.
- What is the effect of quantitative easing? It means that the state (the central bank as part of the state) receives its own bonds from the banks and pays by issuing new (zero interest) money – the banks lose interest income while the government reduces its debt service. It’s a profitable deal for the state – and therefore for the taxpayer. The monetization of government debt is only problematic when it leads to rising inflation rates, ie, to a lower purchasing power of money as rising cash balances in the population meet a slower increase of supply (of goods and services). Since there are lots of idle capacities in the economy, including the labor market, this is not a relevant concern for now. Note, however, that the monetization of debt has also distributional effects, from the poor to the better-off – who will pay less tax.
equities cheap relative to government bonds
- What does all this mean for equities? Since the riskless long-term discount factor is approaching zero in many countries, the present value of future dividends and thus of stock prices will rise (to infinity). In such an environment the usual financial models stop making sense. Simply put: if I do not get any return on one asset I will keep buying the one that does, until risk-adjusted expected returns are the same.
- To be sure, returns on assets must be expected returns, and these are likely to be negative in a deep recession like the present one. The IMF makes the following real GDP y/y predictions for 2020 and 2021: U.S. -8.0% / +4.5%, euro area -10.2% / +6.0%, Germany -7.8% / +5.4%, Japan -5.8% / +2.4%. The rebound will not be dramatic and will not bring economies back to where they were in 2019. Output gaps rise, consumer price inflation goes down further, profits drop steeply and recover only partially. To buy equities reflects the attempt to average down the purchasing price of equities in the portfolio, not yet a bet on rapid profits growth. The risks are to the downside.
- But risk premia on equities are unusually high at the moment, mostly because real riskless bond yields are so low. For the S&P 500 they are at 5.4%, at 5.3% for the DAX and at 3.7% for the Nikkei 225. In other words, compared to bonds, equities in these indices are quite cheap and should be bought.
- Dividend yields also suggest that stocks have upside potential compared to government bonds. The average for the S&P 500 is 2.0%, just as for the Nikkei 225. Germany’s DAX is at 3.1%. I am sure that there will be a large variation within the indices – losers and winners will be more apart than in the past. Don’t buy energy, airlines, cruise ships, hotels, instead buy companies which profit from home working, or food, pharmaceuticals and green energy-related firms.
endowment-style re-allocation of assets
- So, in the end, what are investors going to do? One thing is obvious: the traditional 60% stocks, 40% bonds mix will not perform well. The bonds may provide an element of price stability, but for investors who need an inflow of cash, they are not an option. To maintain a good performance while generating the cash needed for meeting obligations, the recipe is to extend maturities, accept more risk and put less emphasis on liquidity, just as the textbook says.
- The new portfolio structure of U.S. university endowments shows how this can be done.
- The Yale University endowment is one of the largest and most successful: over the past 10 years to mid-2019, it has returned 11.1% per annum, and 11.4% over twenty years. Its value stood at $30.3bn, and spending from the endowment is in the order of $1.4bn per year and thus represents approximately 34% of the university’s net revenues. Harvard’s has an even bigger endowment ($40.9bn) and also contributes more than a third to the university’s expenses.
- Both endowments now a heavy emphasis on risky and illiquid assets. Given that they have been so successful, it is worth having a closer look. How are they positioning themselves at a time when government bond yields are low (yet still falling in the U.S. case) while valuations are very high, especially in terms of price-to-earnings ratios (even more so on the basis of Shiller’s cyclically adjusted p/e ratio).
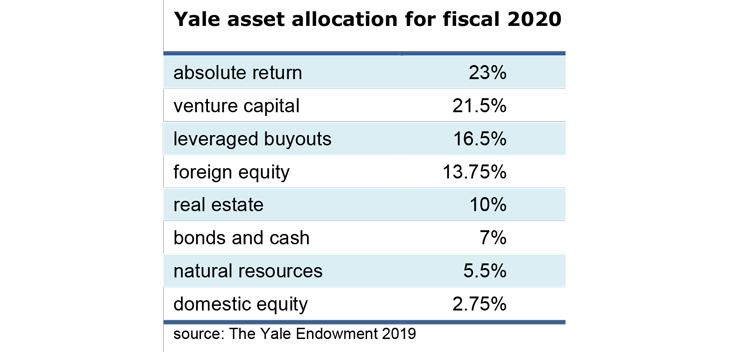
- In the Yale table, the two main risk categories are venture capital and leveraged buyouts; they account for no less than 38% of total assets. The portfolio is certainly not suitable for retail investors because it is very expensive to employ teams of portfolio managers who can keep track of firms – which are often small, loss-making and not listed on a stock exchange. They also cannot control outside risk managers to whom a large chunk of assets has been outsourced by the university endowments.
- The portfolio structure reflects Yale’s distrust of the U.S. stock market (2.75%), but considerable optimism about the future of non-U.S. equities (13.75%). In the longer run, real GDP growth in developing and emerging economies is on average about four percentage points faster than in America which suggests that foreign equities will probably do well. The category bonds and cash gets only 7% of the total. Similarly over at Harvard, where bonds, cash and “other” have a share of 8%. A significant portion of this will be in relatively risky corporate and junk bonds.
- Both endowments have invested more than 20% of the total in market-insensitive “absolute return” assets (Yale) and mostly liquid hedge funds (Harvard). For institutional European asset managers this must look extreme. But they must admit that the results justify the American app
Read the full article in PDF format:
Wermuths Investment Outlook June 26, 2020