
Sell in June and go away – a sensible strategy
introductory remarks
- May is over, and I am late, so I had to replace the initial “May” by “June” in the headline. The rhyme may be gone, but I continue to believe that it makes sense for investors in equities to take a break and stay on the sidelines for a while. Bonds are a different matter. Once again, inflation expectations are on the way down as the global economy has become fragile. That helps.
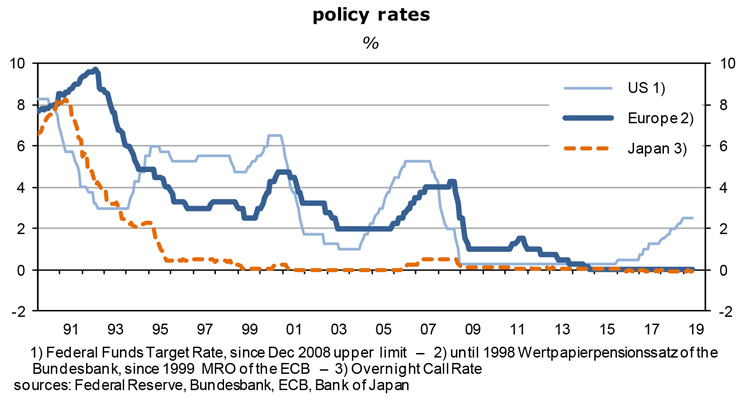
- The recovery that began in spring 2009 has not been strong enough to bring about full employment of labor and capital or a significant acceleration of inflation. For central banks this means they cannot afford to tighten policies any longer, as in the case of the U.S., or to start pushing rates up from the zero bound, as in the euro area and the rest of the world. Monetary policies will largely remain supportive for bonds, stocks, real estate, ie, the prices of financial and other assets, but will do less for the real economy. Central banks are pushing on a string.
- As the expansion has reached old age, it seems to lose momentum. One reason has been the uneven distribution of income and wealth; in the wake of easy money both the value of assets and the income they generate grew faster than nominal GDP. In other words, the expansion of output was mostly to the benefit of a small group of the population, the owners of assets. Median household incomes expanded only slowly, if at all, which in turn meant that the economic expansion has neither gained breadth, nor has it become self-sustained.
from trade war to deflation
- On top of this, there is now the prospect that America’s trade war with China will degenerate into a cold war for global technological leadership that will severely disturb international supply chains, thus make major parts of the capital stock obsolete and cast a chill on trade and investment. The Trump administration is also trying to punish domestic and foreign companies which dare to trade high-tech and defense-related goods and software with China – and Iran. No one knows how this will end. But the loss of confidence is palpable everywhere. Investors and consumers have become increasingly cautious and have cut back their spending plans. For the economy, and for corporate profits and stock markets, this is bad news.
- But it will also reawaken the ghosts of deflation which supposedly had been laid to rest by super-expansionary monetary policies. In the past few weeks, average U.S. inflation expectations for the coming five years have declined by about 30 decimal points to 1.6 percent; German expectations fell by the same amount, to just 0.7 percent, which is far below the ECB’s inflation target of a little below 2 percent. It’s the same message in all major countries.
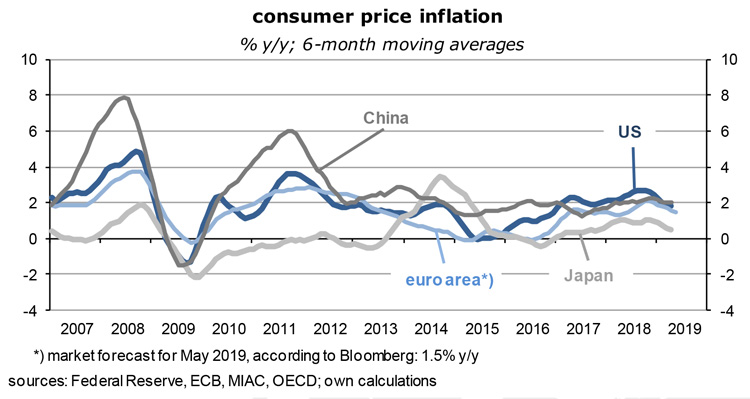
- Investors obviously think that today’s headline inflation rates – of around 2 percent in the U.S., and 1.7 percent in the euro area – will decline, mainly because weakening demand growth will lead to larger output gaps. In such an environment, firms cannot easily raise prices and pass on higher costs, nor are workers able to achieve significant pay hikes. The situation is expected to resemble the one in 2016.
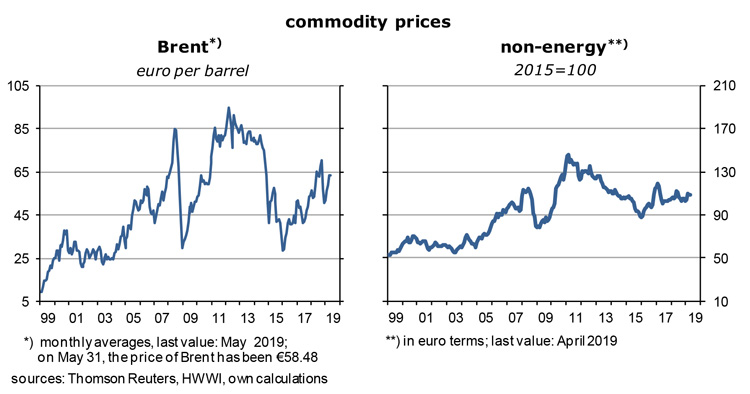
- A supportive factor is commodity prices. Since last fall, import prices in both the United States and Germany are on the way down, not least because commodities have become cheaper again. Gone are the days when market participants were convinced that the strong world economy would bring about steadily rising prices for metals, food and fossil fuels. It is not that a recession is imminent.
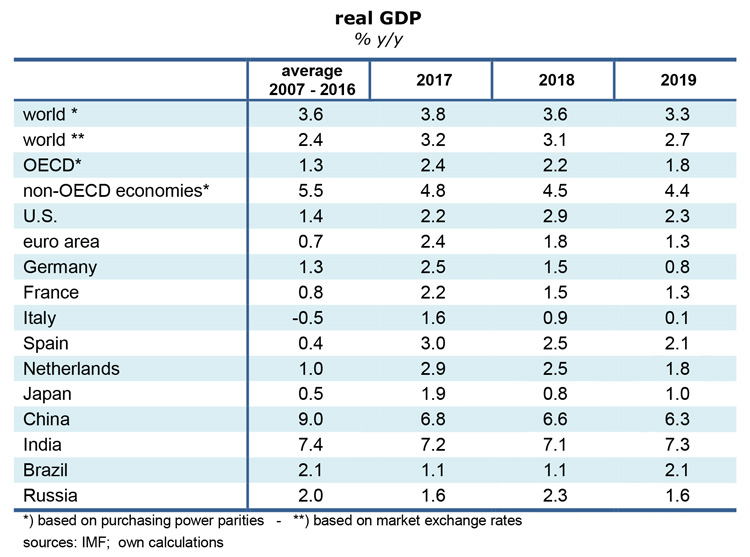
- As the table on page 1 shows, real GDP growth is still rather robust, but it is less dynamic (it is negative in the second derivative, so to speak) – and that is usually enough to dampen the prices of commodities, ie, goods characterized by high volatility, low barriers of entry, high productivity growth and generally a lack of stickiness. They often fall steeply in anticipation of slower growth of demand, before it actually happens. Emerging and developing countries that rely on producing and selling non-oil commodities are obviously affected most, but oil exporters may be the next candidates. Overall, commodity prices are not a major driver of inflation in the rich part of the world anymore, including fossil fuels. Their share in GDP input costs continues to shrink.
ECB has reached the limits of its policies
- So this on its own is good news for holders of fixed-income securities – they can base their portfolio decisions on the assumption that there will be capital gains in response to declining actual and expected inflation rates. As mentioned in the beginning, it has become unlikely that central banks will be able to raise policy rates. Easy policies will persist as far as the eye can see.
- In recent press conferences, Mario Draghi of the ECB has made it very clear that rates will not be raised before 2020, and after that only if there is evidence that headline inflation will come close to 2 percent in a sustainable way: core inflation may have accelerated to 1.3 percent year-on-year in April, from around 1 percent in the previous five (!) years, but this looks like an outlier to me and will soon be reversed. In the United States, meanwhile, the acceleration of core inflation from 1.7 percent in mid-2017 to 2.3 percent one year later – which served to justify the series of Fed funds rate hikes – has been followed by a new decline to around 2 percent. Core inflation is generally regarded as a leading indicator for the politically more sensitive headline inflation.
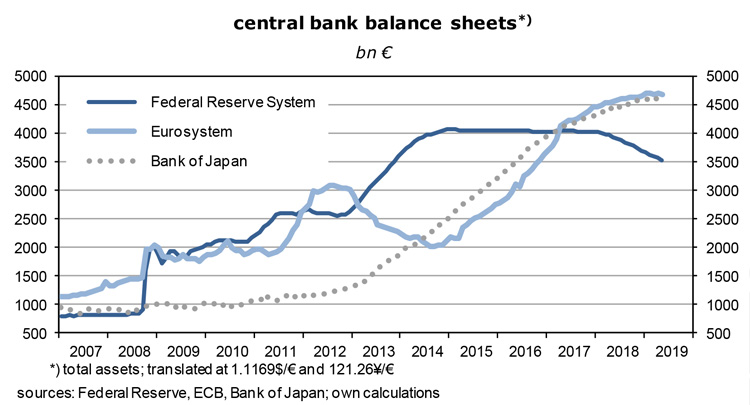
- In the European currency union it is not clear how a more expansionary monetary policy might look like. The ECB’s asset purchasing program has tapered off at the end of 2018. The expansion of the system’s balance sheet and the supply of central bank money to the banking sector has thus come to an end. But easy monetary policies must be maintained in view of depressed inflation expectations and the slow growth of the economy.
- At the press conference on March 7, the ECB announced that it will launch “a new series of … targeted longer-term refinancing operations, starting in September 2019 and ending in March 2021 … to preserve favorable bank lending condition and the smooth transmission of monetary policy.” These “will feature built-in incentives for credit conditions to remain favorable.” The idea is to stimulate, de facto via subsidies, borrowing and capital spending of the private sector.
- Policies will continue to be data-driven and can supposedly be made more expansionary if required. Targeted quantitative easing is now the main monetary instrument because it is almost not possible to lower banks’ deposit rate at the ECB of presently -0.4% any further. Holding cash (which does not pay a negative interest rate – yet) would soon become a popular alternative to bank deposits in a world of negative interest rates – which would then force the ECB to somehow restrict its use. I can also imagine the launch of a new round of quantitative easing of the traditional sort.
- In the U.S., things are obviously easier from an operational point of view. Since December 20, 2018, the effective Fed funds rate fluctuates around 2.4% and is thus much higher than the ECB’s policy rate. According to futures markets, it will be down to 1.69% in a year’s time (while the euro deposit rate is expected to be more or less unchanged at -0.46%) which implies two or three 25-basis point cuts of the Funds rate. So far, markets are betting that 1.5% will be the lower turning point two years from now.
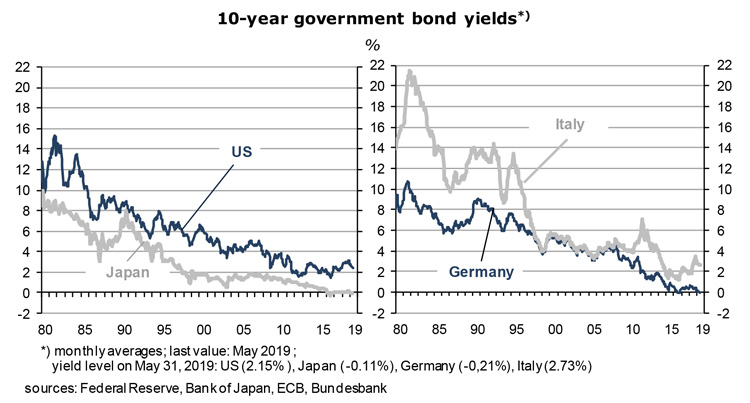
- Another implication is that capital gains in U.S. bond markets will be much larger than, for instance, in Germany. If 10-year yields fall to -0.2% (the present yield of Bunds) investors can expect capital gains of more than 20 percent – and none in Germany if bond yields stay where they are.
- Note that there is an exchange rate risk that cannot be ignored, though. If the dollar depreciates a lot, capital gains of dollar bonds can be wiped out form investors who have another home currency. I come back to this point later.
fiscal policies and MMT (the Modern Monetary Theory)
- Many years ago, fiscal policies were regarded as the most important driver of bond yields, but no longer. A new strand of economic reasoning called Modern Monetary Theory (MMT) comes to the conclusion that even high government debt levels and large budget balances have no adverse effects on inflation and bond yields – as long as there are spare capacities. Prime examples that support this view are the United States and Japan. The following graphs show that for these two countries deficits and debt were indeed irrelevant for the cost of public sector borrowing.
- In the U.S., the record low unemployment rate of 3.6 percent does not mean full employment has been achieved – the labor force participation rate is still depressed at 62.8 percent, much lower than the 66 percent that were the standard before the Great Financial Crisis. A case can also be made that real GDP growth has been less than potential growth during the past ten years and that, as a result of this, the inflation-depressing output gap is quite large. Both nominal and real bond yields are extremely low (and falling) in spite of what can be called, from a historical perspective, reckless fiscal policies.
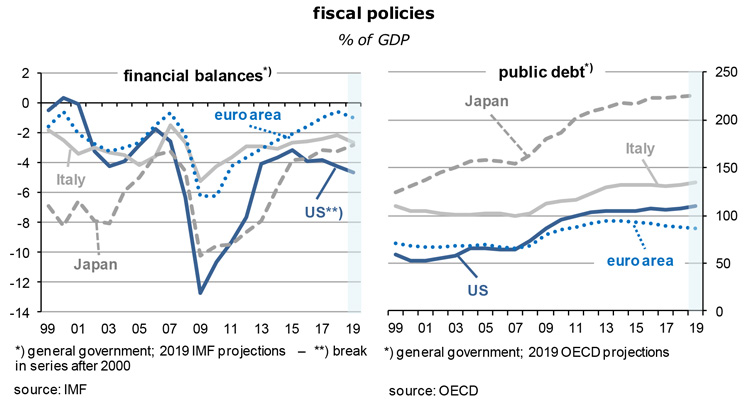
- The situation in Japan is even more extreme. Government debt has been well over 200 percent of GDP for more than a decade, the larger part of newly issued government bonds disappears in the balance sheet of the Bank of Japan (known as money printing), while budget deficits fluctuate around 3 percent of GDP. Market participants couldn’t care less and refuse to end their love affair with Japanese government bonds (JGBs). In the 10-year range, the nominal yield is -0.11% while the real yield is more like -0.3% (based on inflation-protected bonds).
- I think the evidence does not unambiguously support MMT. Countries with conservative fiscal policies in the traditional sense typically enjoy lower real and nominal bond yields than countries with large deficits and debt. On the one hand you find Switzerland, Germany, Denmark, the Netherlands, Finland, Sweden and Austria with negative or very low positive
10-year yields. The governments of all these countries have sound finances. Deficits and debt are noticeably (but not dangerously) higher in Greece, Italy, the U.S., the UK, Portugal, Spain, and France, and so are government bond yields. In a cross-country comparison there is no empirical evidence that the budget situation of a country does not matter. In this respect at least, MMT cannot be verified.
a closer look at three risky bond markets
- Bond investors who can afford to take some risk may want to have a closer look at Italy, Russia and Turkey.
- In the 10-year range, Italy’s government bond yield is now 2.67% and thus higher than the yield of comparable U.S. Treasuries – for much of this year, the difference between the two had been almost non-existent. Inflation will probably be less than 1 percent this year, the balance on current account is heading for a surplus of 2 percent of GDP, and the government budget deficit, the main worry of financial investors, will be around 3% of GDP, hardly a catastrophic number given that the country’s economy operates far below potential after a seemingly never-ending recession. Buying the 3% BTPS maturing in August 2029 would be a bet that Italy will have no problem serving its debt and will also remain a member of the euro area. Even the extreme-right Lega does not intend to give up the common currency.
- It would be a repeat of what we have seen in Greece where yields have fallen from 11½ % in February 2016 to 2.87% last Friday. Potential gains in Italian bonds will of course be smaller, but so are risks. Other attractive euro area bond markets are Portugal (0.81%), Spain (0.72%) and even France (0.22%), perhaps in combination with short positions on Bunds.
- Rouble-denominated Russian government bonds yield 7.9% right now. For comparison, consumer price inflation is at 5.2% y/y, expected (5-year) inflation at 4.3% – real yields are therefore fairly high. Moreover, there are some other strong fundamentals: the government budget is heading for a surplus of 2 percent of GDP this year, and the balance on current account will show a plus of almost 7 percent. Keep in mind that the rouble has depreciated from 32 per dollar to 65 today over the past six years – its decline has not only slowed recently, it has been reversed. The currency looks strong, at least for now and probably for the rest of the year, even if the all-important oil price continues to fall. For investors who want to eliminate FX risk there is a dollar-denominated 4 3/8% government bond which yields 4.16%, or almost 200 basis points more than a same-maturity U.S. Treasury. And to re-assure skeptics: Russia has historically been a solid debtor.
- Turkey, of course, offers a much bigger risk-return trade-off. 10-year bonds yield no less than 18.0% at this point. To buy them would make a lot of sense if inflation comes down from its current 19.5% y/y level – the recession that is under way could just possibly do that. Year-over-year, the lira has already fallen by almost one quarter against the dollar and can reasonably be expected to stabilize from here on: the current account deficit will be less than 1 percent of GDP this year, and the government’s budget deficit will be a moderate 2 ½ % of GDP. Looks better than the U.S., doesn’t it? In any case, the very high risk premium is a good protection against losses caused by further depreciations.
after a long run, stock markets are declining
- Turning to equities, they had a very good year until recently. One reason was that investors didn’t like bonds: in the U.S., rising Fed funds rates meant that the cost of carry made them increasingly less attractive, and in Europe real yield levels of German and other high-quality fixed income securities had moved far into negative territory. On the basis of dividend yields alone, equities were regarded as a plausible alternative to bonds – as long as investors were relaxed about the possibility of a recession.
- Going forward, I wonder whether this is still the case. One statistic which is usually a reliable predictor of a U.S. and, by implication, a world recession is the slope of the Treasury yield curve, in particular between two and ten years: when it turned negative in the past, a recession invariably followed after one to two years. Why should this be so? At the short end of the curve, rates could rise because of a more restrictive monetary policy, and thus dampen the demand for goods and services; at the long end, the relative decline of yields may be an indicator of lower inflation expectations and also of a weakening demand for goods and services. Various other combinations of developments may also bring about a tilting of the curve and a recession.
- The inversion is not yet here. The difference between 10 and 2-year Treasuries has shrunk for several years and has reached just 20 basis points at the end of May – but it has not turned negative. I wonder whether this will actually happen during the present business cycle. I had shown above that market participants expect U.S. policy rates to decline from here on, which would lower the short end and thus steepen the yield curve, which in turn makes a recession less likely. How about the 10-year yield? Could it come down by even more than the 2-years? The escalating trade and technology war certainly has the potential to disrupt supply chains and to shock business. They would cut back their capital spending plans. Consumers, on the other hand, would suffer from higher inflation, caused by rising import prices, and would also start to hold back on spending.
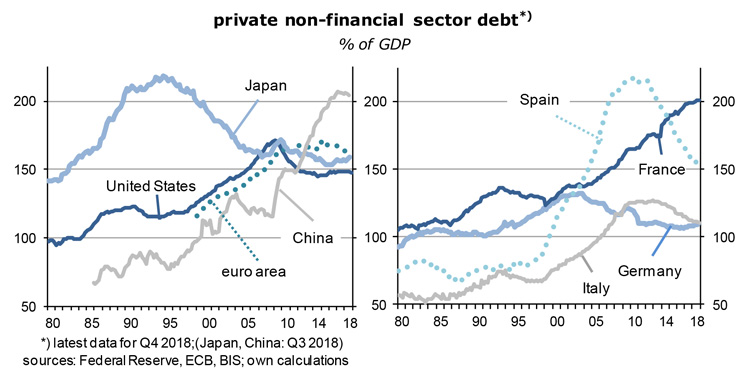
- Falling short interest rates and an even bigger decline of the long end is a non-negligible scenario which could portend a recession further down the road. Another risk is that private sector debt relative to GDP has reached levels that are comparable to the situation before the Great Financial Crisis in 2007/2008. The following graph shows that this includes China and France, but also the United States, Japan and the euro area as a whole, all of them economic heavyweights. If they are forced by markets to defend their creditworthiness and start to deleverage, ie, to reduce their debt, this will cause more than just a ripple in the world economy
- The trigger for a downward spiral would normally be a tightening of monetary policies, or a large appreciation of the exchange rate. In response, expected returns from the assets bought with borrowed money would fall below the cost of funding, which destroys prevailing business models. A chain reaction starts as debt reduction becomes the order of the day. Once the unwinding begins, spending will be reduced, together with an increase in savings. At the same time, defaults rise and banks see their non-performing loans explode. In response, credit standards are tightened and the volume of lending shrinks. The financial crisis then leads to a recession.
- As things stand today, a tightening of monetary reins looks unlikely. Stock markets are rather safe on that front. Another trigger could be a major bank default, though. When, and whether there will be a tipping point after which deleveraging picks up speed and things get out of control, is impossible to predict. But the risk is not just theoretical.
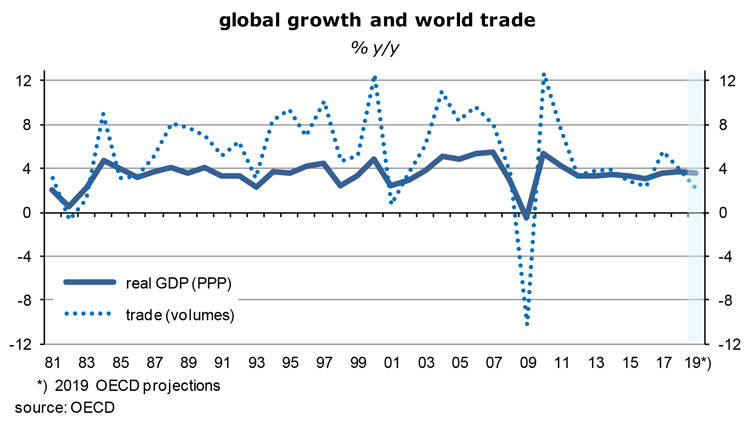
- In addition, stock markets have been closely correlated with the volume of world trade, and world trade has not done well recently and will probably not do well in the near future. In the old days (pre-2008-crisis) world trade had expanded about 1.8 times faster than global GDP, a sign that the international division of labor kept intensifying. The following graph shows that this is no longer the case. Globalization keeps slowing, not least because of Mr. Trump’s belligerent trade policies. Bad news for stock markets!
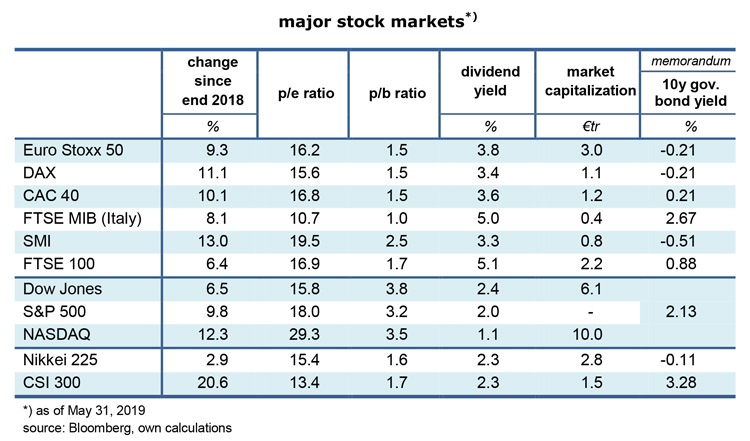
- Looking again at the stock market table above, the main message is that U.S. stocks are relatively expensive compared to others, especially on the basis of price-to-book ratios. Investors are obviously convinced that American firms are much better managed than their European and Asian competitors. Does this make sense? I have my doubts. U.S. corporates also distribute much less cash to their owners than the Europeans.
- Are capital gains generally preferable to pay-outs? Not if external (borrowed) funds are cheaper than retained earnings. This is usually the case, and certainly in today’s low interest rate environment. Pension funds and other institutional investors must generate cash to meet their obligations. Capital gains are a less reliable source of income than dividends – and there is the ever-present risk that stock markets sometimes fall. Recall that the rally is now more than ten years old.
- In terms of price-to-earnings ratios, valuations are still quite generous. No one would be surprised if they were adjusted down by 10 percent and more, in response to the slowdown of economic growth that is now under way. Based on cyclically adjusted corporate earnings (which are lower than actual earnings at this late stage of the business cycle) p/e ratios are very high.
- The main outlier in this rather gloomy picture are Italian stocks. Italy seems to be in a never-ending recession, and has not managed to elect truly professional and stable governments for decades. Unemployment, especially youth unemployment is significantly higher than the euro area average. The general perception among investors is that the country is a mess, and will remain a mess. I beg to differ. I had mentioned in the bond section above that Italy is comfortably able to service its debt, most of which is held domestically (as in Japan). The level of government debt is not much higher than that of the U.S., and average interest rates are probably lower. As a result of below-par economic growth and near-zero inflation, Italy has begun to run current account surpluses which means it reduces its foreign debt. Because of those low inflation rates, the “Italian euro” has depreciated which has made the economy rather competitive in terms of prices.
- To sum up, I do not argue to sell equities in any aggressive way. But my above list of potential risks has become longer than I had initially expected: slower growth, perhaps a recession, a near-inversion of the U.S. yield curve, high private sector leverage in some large countries, the slowdown of world trade growth, high valuations and, last but not least, the old age of the global stock market rally. The time has not yet come to load up on equities again.
foreign exchange rates ….
- Finally, some remarks about foreign exchange and the state of the world climate.
- For me, it is a puzzle why the euro continues to lose ground against the dollar. Two fundamentals suggest that this should not be the case: the euro area runs a current account surplus of at least 3 percent of GDP this year, as it has for several years now, whereas the U.S. can expect a deficit of about 2 ½ percent. Financial investors should also be impressed by the (likely) aggregated 1.2 percent of GDP budget deficit of European governments – it compares with an American shortfall of no less than 4 ½ percent. For both reasons, the underlying demand for euros is quite strong and should cause appreciations.
- The factors that drag down the euro are relatively high U.S. policy rates and bond yields, plus expectations that America’s economic growth, and therefore the growth of corporate earnings, will be significantly higher than Europe’s and, more recently, the escalation of the trade and technology war where the old continent is seen to be on the receiving end while the U.S. calls the shots. In times of political crisis, the motto is to buy America. The country still has the strongest military by far. Investors from outside Europe are also often at a loss about the future of the euro, that strange animal. Can it survive without some sort of fiscal and political union? Aren’t the successful populist and nationalist parties a sign that the EU may break up?
- Inside Europe, the perception is quite different. Approval rates of the EU are well above 75% in 27 of the 28 member countries. Free travel, the possibility to work in other countries as well as substantial transfers from rich to poor countries are attractive features, especially for the former Communist countries, even where anti-EU parties are in government.
- As it is, the U.S. has no problems attracting foreign capital, and it is therefore probably too early to bet against the dollar. Capital flows clearly dominate the direction of the euro/dollar exchange rate – the dollar strength is the collateral benefit of having the largest, safest and most diversified capital market.
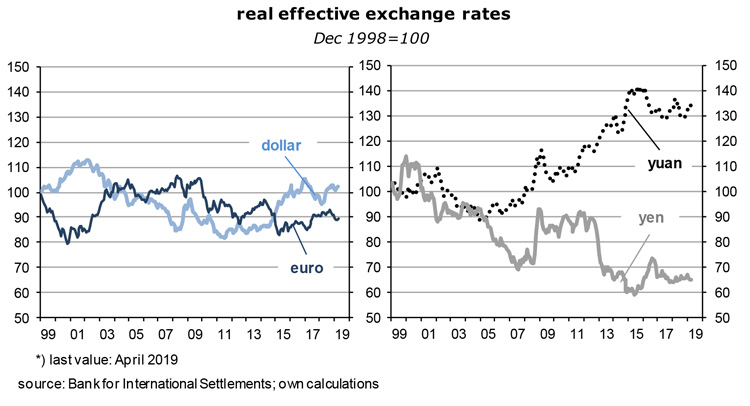
- The second most important exchange rate is the one between dollar and the Chinese yuan (CNY). Over the ten years to 2005, it had been stable at 8.28 yuan to the dollar, then appreciated to 6 yuan in late 2013, and has been on a gradual downtrend since, to stand at 6.91 today. The depreciation has helped to prop up China’s economy as it transits from 10 percent real GDP growth rates and an emphasis on manufacturing, infrastructure and exports to a 6 ½ percent growth environment and rising shares of domestic demand and services.
- As the following graph shows, the yuan is quite expensive in real terms. This is probably the main reason why the surplus in the balance on current account has declined steeply since 2009 and is now approaching zero. The exchange rate is not a bone of contention between the U.S. and China. The stable level of FX reserves (around USD 3tr, mostly U.S. government debt) suggests there aren’t any significant interventions either way. This can probably be extrapolated.
- Since the early nineties, the yen is de facto pegged to the dollar, at around 100 to the dollar. The wild gyrations that had characterized the seventies and eighties have given way to fluctuations in a range from 80 to 120. The dollar is at 108 yen today. Since Japan has, from an FX perspective, sound fundamentals, including a large current account surplus and huge FX reserves (but also a world-beating budget deficit), it is increasingly regarded as a safe haven currency. If I go by the 225 basis point U.S./Japan yield difference in 10-year government bonds, markets expect an average annual appreciation of the yen of 2 ¼ percent over the coming ten years. No one complains about an unfair yen exchange rate these days, and I see little reason why this should change.
- Sterling is a volatile and weak exchange rate, as the British cannot make up their mind whether they belong to Europe or not. At the launch of the euro in January 1999, 0.71 pounds bought 1 euro; the exchange rate has now arrived, after some wild fluctuations, at 0.884. In the long run it would make sense to peg sterling closely to the euro because the euro area is the country’s biggest trading partner by far. Large swings in the bilateral exchange rate mean large changes in price signals – which is costly. Investments which may make sense today from a price competitiveness point of view, may not make sense tomorrow in a significantly different exchange rate environment. Such considerations do not play a role in the near term. Uncertainty will prevail until the Brexit process has been concluded. Buy volatility.
…. and the ongoing deterioration of the climate
- To conclude, let me give you my take of the status of the world’s climate. The issue has played a dominating role in recent European, especially German elections. If you just take the hard numbers you can easily despair which explains the huge electoral success of the Greens. In spite of all the publicity given to the deterioration of the climate and the strategies to mitigate global warming, nothing has been achieved so far. Have a look at the next table.
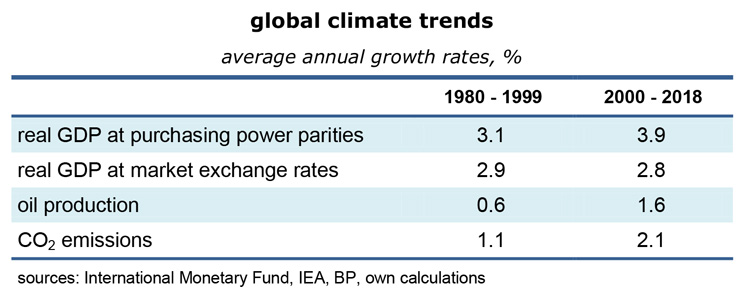
- Most worryingly, oil production continues to expand at half the rate of global real GDP, without a noticeable slowdown in recent years. As a rule of thumb, oil output grows by an average of 1 ½ percent a year, while GDP growth follows a trend rate of about 3 percent. And the dangerous CO2 emissions increase even somewhat faster than oil supply – because many countries, especially poor ones, still rely on burning coal, a worse pollutant than oil. This will change as alternative energy gets cheaper rapidly and as countries are pushed by the younger part of the electorate to introduce CO2 taxes that bite. But the battle is not yet won, and progress is too slow.
Read the full article in PDF format:
Wermuths Investment Outlook June 3, 2019